
Page 3 - Module & Head and Shoulders
P. 3
Module 7 – Head and Shoulders
1. introduction
A Head and Shoulders reversal pattern forms after an uptrend, and its completion marks a trend
reversal. The pattern contains three successive peaks with the middle peak (head) being the highest
and the two outside peaks (shoulders) being low and roughly equal. The reaction lows of each peak
can be connected to form support, or a neckline.
The head and shoulders pattern doesn’t come around often but when they do the profits can be
considerable. The pattern appears on all times frames and can therefore be used by day and swing
traders as well as investors. While subjective at times, the complete pattern provides entries, stops
and profit targets making it easy to implement a trading strategy.
The head and shoulders chart pattern is a price action strategy and is based on a reversal pattern
that is mostly seen in uptrends. In this module, you will learn how to trade this pattern by learning
to recognize this pattern when it starts to form and then trading it.
2. construction of the head and shoulders pattern
The head and shoulder chart pattern can form in
any time frames, from 1 minute up to the
monthly time frame. But do you know what it
looks like? As its name implies, the Head and
Shoulders reversal pattern is made up of a left Both head and shoulders have a similar construction in
shoulder, a head, a right shoulder, and a that there are four main parts to the head-and-shoulder
chart pattern: two shoulders, a head and a neckline. The
neckline. patterns are confirmed when the neckline is broken, after
the formation of the second shoulder. The head and
Other parts playing a role in the pattern are shoulders are sets of peaks and troughs. The neckline is a
volume, the breakout, price target and support level of support or resistance. An upward trend, for
turned resistance. example, is seen as a period of successive rising peaks and
rising troughs. A downward trend, on the other hand, is a
The most common entry point is a breakout of period of falling peaks and troughs. The head-and-
the neckline, with a stop above (market top) or shoulders pattern illustrates a weakening in a trend where
there is deterioration in the peaks and troughs.
below (market bottom) the right shoulder.
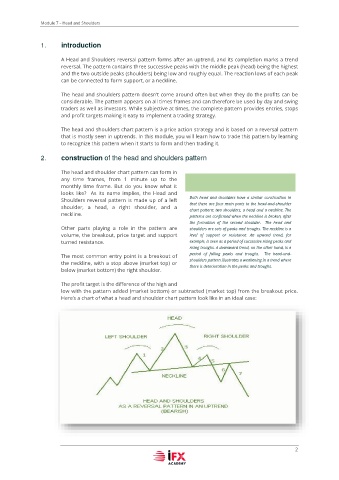
The profit target is the difference of the high and
low with the pattern added (market bottom) or subtracted (market top) from the breakout price.
Here’s a chart of what a head and shoulder chart pattern look like in an ideal case:
2