
Page 23 - DTI Prosperity Plan 2022
P. 23
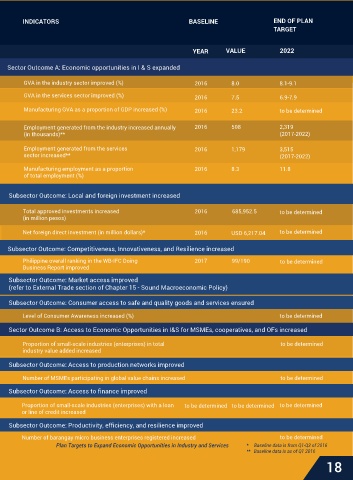
INDICATORS                                     BASELINE                END OF PLAN
                                                                               TARGET


                                                        YEAR      VALUE          2022

   Sector Outcome A: Economic opportunities in I & S expanded

        GVA in the industry sector improved (%)          2016      8.0           8.1-9.1
        GVA in the services sector improved (%)          2016      7.5           6.9-7.9

        Manufacturing GVA as a proportion of GDP increased (%)  2016  23.2       to be determined

        Employment generated from the industry increased annually   2016  508    2,319
        (in thousands)**                                                         (2017-2022)

        Employment generated from the services           2016      1,179         3,515
        sector increased**                                                       (2017-2022)
        Manufacturing employment as a proportion         2016      8.3           11.8
        of total employment (%)

    Subsector Outcome: Local and foreign investment increased

        Total approved investments increased             2016      685,952.5     to be determined
        (in million pesos)

        Net foreign direct investment (in million dollars)*  2016  USD 6,217.04  to be determined

   Subsector Outcome: Competitiveness, Innovativeness, and Resilience increased
        Philippine overall ranking in the WB-IFC Doing   2017      99/190        to be determined
        Business Report improved
    Subsector Outcome: Market access improved
    (refer to External Trade section of Chapter 15 - Sound Macroeconomic Policy)

    Subsector Outcome: Consumer access to safe and quality goods and services ensured

       Level of Consumer Awareness increased (%)                                 to be determined
    Sector Outcome B: Access to Economic Opportunities in I&S for MSMEs, cooperatives, and OFs increased
       Proportion of small-scale industries (enterprises) in total               to be determined
       industry value added increased
    Subsector Outcome: Access to production networks improved

       Number of MSMEs participating in global value chains increased            to be determined
    Subsector Outcome: Access to finance improved

       Proportion of small-scale industries (enterprises) with a loan  to be determined  to be determined  to be determined
       or line of credit increased
    Subsector Outcome: Productivity, efficiency, and resilience improved
       Number of barangay micro business enterprises registered increased        to be determined
                 Plan Targets to Expand Economic Opportunities in Industry and Services  *     Baseline data is from Q1-Q3 of 2016
                                                                       **   Baseline data is as of Q1 2016
                                                                                              18