
Page 71 - ASBIRES-2017_Preceedings
P. 71
DOWNTIME ANALYSIS OF EXPELLER MACHINES – A CASE STUDY
Finally, the production loss due to machines
breakdown were estimated.
4 DATA COLLECTION AND
ANALYSIS
In present study, breakdown times of
the expeller machines have been evaluated
in randomly selected machines. A simple
random sample of 12 expeller machine out
of 30 was directly observed to gather
primary data.
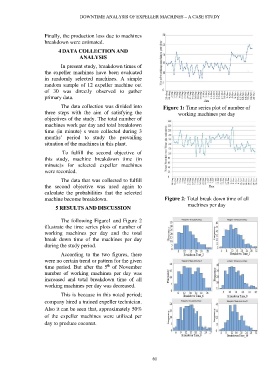
The data collection was divided into Figure 1: Time series plot of number of
three steps with the aim of satisfying the working machines per day
objectives of the study. The total number of
machines work per day and total breakdown
time (in minute) s were collected during 3
months’ period to study the prevailing
situation of the machines in this plant.
To fulfill the second objective of
this study, machine breakdown time (in
minute)s for selected expeller machines
were recorded.
The data that was collected to fulfill
the second objective was used again to
calculate the probabilities that the selected
machine become breakdown. Figure 2: Total break down time of all
machines per day
5 RESULTS AND DISCUSSION
The following Figure1 and Figure 2
illustrate the time series plots of number of
working machines per day and the total
break down time of the machines per day
during the study period.
According to the two figures, there
were no certain trend or pattern for the given
th
time period. But after the 5 of November
number of working machines per day was
increased and total breakdown time of all
working machines per day was decreased.
This is because in this noted period;
company hired a trained expeller technician.
Also it can be seen that, approximately 50%
of the expeller machines were utilized per
day to produce coconut.
61