
Page 56 - Property Sustainability Report 2015
P. 56
Category Bio‐diesel1
Direct CO2e emissions2
Refrigerants containing HCFCs re lled
Potable water for general use3
Wastewater discharge5
Waste disposal
Grease trap waste7
Waste Recycling9
Plastic
Unit Litres
Tonnes
kg
Cubic metres
Cubic metres
Tonnes
kg
2010/11 2011/12 2012/13
45,200 57,800 156,920
1,169 1,217 1,339
2,984 2,000 2,093
798,087 770,069 858,971
793,800 767,637 856,542
1,092 976 1,101
7,931 15,514 9,111
2013/14 2014/15
157,500 58,000
1,308 993
1,398 1,739
849,263 734,808
844,964 730,996
1,146 1,047
3,490 6,904
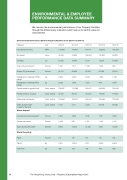
We monitor the environmental performance of our Property Facilities through the following key indicators which help us to identify areas for improvement.
Environmental Performance Data for Property Facilities from 2010/11 to 2014/15.
Purchased electricity
MWh
143,549
143,427
140,311
136,243
138,338
Towngas
GJ
16,762
16,794
17,107
16,202
15,368
Indirect CO2e emissions
Tonnes
91,070
93,895
91,829
93,292
90,178
Refrigerants containing HFCs re lled
kg
2,026
1,925
1,022
845
1,826
Potable water for cooling4
Cubic metres
48,135
86,127
120,287
179,397
170,613
Waste potable water reused for ushing
Cubic metres
1,007
2,171
2,222
20,795
26,846
Domestic/Commercial waste6
Tonnes
7,599
7,822
7,159
7,761
7,695
Spent uorescent tubes8
Number
9,593
13,872
21,408
7,307
13,665
Paper
Tonnes
147
157
145
121
100
Aluminium
kg
486
703
729
438
566
56
The Hong Kong Jockey Club – Property Sustainability Report 2015
ENVIRONMENTAL & EMPLOYEE PERFORMANCE DATA SUMMARY
