Page 47 - OCHA-PHL-Consolidated-Provincial-Profiles-March-2018
P. 47

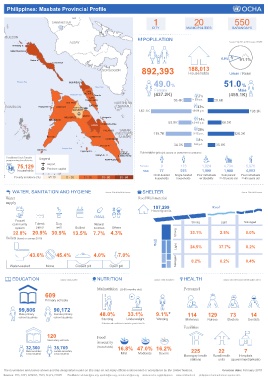
Philippines: Masbate Provincial Profile
                                                                     1                 20                550
                        CAMARINES SUR
                                                                     CITY           MUNICIPALITIES      BARANGAYS

   QUEZON                                                        POPULATION
                                ALBAY                                                                  Source: PSA 2015 & 2010 Census / DSWD
       Ambulong Is.
      SAN PASCUAL
                                                                                                   8.9%    91.1%
               Burias Is.
                        CLAVERIA
                                                                892,393              188,013
                                              SORSOGON                               Households        Urban / Rural
         Sibuyan Sea            MONREAL
                                                                     49.0%                          51.0 %
                                           Ticao Pass
                                       SAN                            Female                               Male
                                      JACINTO
                                Masbate Pass  Ticao Is.              (437.2K)            7%            (455.1K)
                                         SAN
                                       FERNANDO                               36.4K    > 59 y.o.  28.6K
                               BALENO               NORTHERN
   ROMBLON        Napayawan Is.  AROROY  CITY OF  BATUAN  SAMAR                          43%
                                 MASBATE                       187.1K                 19-59 y.o.                198.3K
                                      MOBO
                              MILAGROS        Deagan Is.
                       MANDAON                                                           14%
                                              DIMASALANG                    59.9K     13-18 y.o.    66.0K
                                          USON
                                               PALANAS  SAMAR                            28%
                                                    (WESTERN         119.7K            3-12 y.o.         126.3K
                      BALUD              CAWAYAN      SAMAR)
                                                CATAINGAN                                8%
                                                                              34.0K    0-2 y.o.  35.8K
                                              PLACER
                             Visayan Sea
                 Jintotolo Is.
                                     Tagauayan Is.     PIO V.  Vulnerable groups (based on DSWD-NHTS database)
                                                      CORPUZ
                                           Olutaya Is.  (LIMBUHAN)
    Conditional Cash Transfer  Legend
    programming beneficiaries                   ESPERANZA
         75,129       Airport                                  Female   9        173       1,924     4,734    5,976
         households   Province capital                           Male   77       975       1,988     1,988    4,993
                                                                                                   Solo parent
                                                      61 - 84
       Poverty incidence (%)
      CAPIZ           </= 10  11 - 30  31 - 50  51 - 60  CEBU        Child-headed  Single-headed  Poor individuals  =>18 years old  Poor individuals
                                                                      households
                                                                               households
                                                                                          w/ disability
                                                                                                            =>65 years old
                  ILOILO
       WATER, SANITATION AND HYGIENE            Source: PSA 2015/2010 Census  SHELTER                       Source: PSA 2015 Census
    Water                                                     Roof/Wall material
    supply
                                                                     187,299                   Roof
                                                                    Housing units
        Faucet                                                                        Strong       Light     Salvaged
       community   Tubed;   Dug            Natural
        system   piped    well    Bottled  sources  Others
       22.8%   20.9%    30.9%    13.5%    7.7%    4.3%                         Strong  33.1%       2.5%       0.0%
    Toilets (based on census 2010)
                                                                       Wall
                                                                               Light  24.5%       37.7%       0.2%
              43.6%       45.4%            4.0%       7.0%
                                                                               Salvaged  0.2%      0.2%       0.4%
     Water-sealed     None         Closed pit     Open pit
       EDUCATION            Source: DepEd 2016  NUTRITION             Source: FNRI 2013/2015  HEALTH  Source: DOH (Personnel 2016/Facilities 2017)
                                            Malnutrition  (0-60 months old)        Personnel
                     609
                     Primary schools

         99,806          90,172
         Male primary    Female primary      48.0%        33.1%       9.1%*         114      129       73       14
         school students  school students
                                              Stunting   Underweight   Wasting      Midwives  Nurses  Doctors  Dentists
                                              * Estimates with coefficient of variation greater than 20
                                                                                   Facilities
                      120                   Food
                      Secondary schools
                                            insecurity
             32,360      35,709             (households)  16.8%  47.0% 16.2%
             Male secondary   Female secondary                                        225         22          7
             school students  school students          Mild   Moderate  Severe
                                                                                   Barangay health  Rural health  Hospitals
                                                                                      stations    units  (government/private)
   The boundaries and names shown and the designations used on this map do not imply official endorsement or acceptance by the United Nations.                                    Creation date: February 2018
   Sources: PSA, DOH, NAMRIA, FNRI, DepEd, DSWD        Feedback: addawe@un.org, aportol@un.org, mendoza1@un.org     www.unocha.org/philippines     www.reliefweb.int      philippines.humanitarianresponse.info
   42   43   44   45   46   47   48   49   50   51   52