Page 79 - OCHA-PHL-Consolidated-Provincial-Profiles-March-2018
P. 79

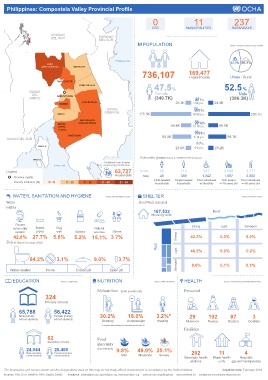
Philippines: Compostela Valley Provincial Profile
                                                                     0                 11                237

                                                                     CITY           MUNICIPALITIES      BARANGAYS
                        AGUSAN
                        DEL SUR              SURIGAO
                                             DEL SUR
                                                                 POPULATION                            Source: PSA 2015 & 2010 Census / DSWD


                                                    Philippine Sea
                      LAAK                                                                              43.1% 56.9%
                    (SAN VICENTE)  MONKAYO
                                                                736,107              169,477           Urban / Rural
                                                                                     Households
                           MONTEVISTA
                                    COMPOSTELA
                                                                      47.5%                          52.5 %
              DAVAO                                                   Female                               Male
               DEL        NABUNTURAN
              NORTE                                                   (349.7K)            7%           (386.3K)
                                     NEW BATAAN
                            MAWAB                                              25.2K   > 59 y.o.  24.3K
                                                 DAVAO                                   51%
                                               ORIENTAL
                           MACO                                175.5K                  19-59 y.o.               203.1K
                                     MARAGUSAN
                                    (SAN MARIANO)                                        12%
                           MABINI                                            44.4K                46.8K
                           (DOÑA                                                       13-18 y.o.
                           ALICIA)
                                                                                         23%
                               PANTUKAN                                  80.8K                        86.7K
    DAVAO DEL SUR                                                                      3-12 y.o.
                                                                                         7%
                  Mawes Is.
                                                                               23.6K   0-2 y.o.  25.2K
                                                               Vulnerable groups (based on DSWD-NHTS database)
                Talikud Is.
                                               Conditional Cash Transfer
                         Davao Gulf            programming beneficiaries
    Legend                                          63,727     Female   15       113       977       3,598    3,777
                                                    Households   Male   46       389       1,342     1,587    3,882
       Province capital
                                                                                                   Solo parent
       Poverty incidence (%)  </= 10  11 - 30  31 - 50  51 - 60  61 - 84  Child-headed  Single-headed  Poor individuals  =>18 years old  Poor individuals
                                                                                households
                                                                      households
                                                                                          w/ disability
                                                                                                            =>65 years old
       WATER, SANITATION AND HYGIENE            Source: PSA 2015/2010 Census  SHELTER                        Source: PSA 2015 Census
    Water                                                      Roof/Wall material
    supply
                                                                     167,532                    Roof
                                                                    Housing units
        Faucet                                                                                                Salvaged
       community   Tubed;   Dug            Natural                                    Strong       Light
        system   piped    well     Bottled  sources  Others
       42.8%    27.7%    5.6%     5.2%    15.1%   3.7%                         Strong  42.3%       0.3%       0.0%
    Toilets (based on census 2010)
                                                                       Wall
                                                                                Light  46.2%       9.0%       0.2%
              84.2%       3.1%             9.0%       3.7%
                                                                               Salvaged  0.6%      0.1%       0.1%
      Water-sealed    None         Closed pit     Open pit

       EDUCATION            Source: DepEd 2016  NUTRITION             Source: FNRI 2013/2015  HEALTH  Source: DOH (Personnel 2016/Facilities 2017)

                                            Malnutrition  (0-60 months old)        Personnel
                     324
                     Primary schools
         65,788          58,422
         Male primary    Female primary      30.2%        18.0%       3.2%*          29       192      87        3
         school students  school students
                                              Stunting   Underweight   Wasting      Midwives  Nurses  Doctors  Dentists
                                              * Estimates with coefficient of variation greater than 20
                                                                                   Facilities
                      62                    Food
                      Secondary schools
                                            insecurity
             24,044      25,460             (households)  9.8%  48.9% 25.1%
             Male secondary   Female secondary                                        202         11          4
             school students  school students          Mild    Moderate  Severe
                                                                                   Barangay health  Rural health  Hospitals
                                                                                      stations    units  (government/private)
   The boundaries and names shown and the designations used on this map do not imply official endorsement or acceptance by the United Nations.                                    Creation date: February 2018
   Sources: PSA, DOH, NAMRIA, FNRI, DepEd, DSWD        Feedback: addawe@un.org, aportol@un.org, mendoza1@un.org     www.unocha.org/philippines     www.reliefweb.int      philippines.humanitarianresponse.info
   74   75   76   77   78   79   80   81   82   83   84