Page 80 - OCHA-PHL-Consolidated-Provincial-Profiles-March-2018
P. 80

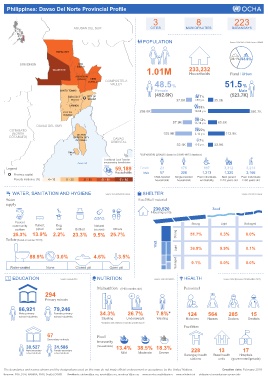
Philippines: Davao Del Norte Provincial Profile
                                                                     3                  8                223

                                  AGUSAN DEL SUR                    CITIES          MUNICIPALITIES      BARANGAYS


                                                                 POPULATION                            Source: PSA 2015 & 2010 Census / DSWD

                          KAPALONG
                                                                                                        36.1%  63.9%
          BUKIDNON                  SAN
                                   ISIDRO
                        TALAINGOD                                 1.01M              233,232
                                   ASUNCION                                          Households        Rural / Urban
                                   (SAUG)  NEW
                                        CORELLA  COMPOSTELA
                                                  VALLEY              48.5%                          51.5 %
                            SANTO TOMAS                               Female                               Male
                                                                      (492.6K)                         (523.7K)
                               BRAULIO E.  CITY OF                                        7%
                                DUJALI  TAGUM                                  37.8K    >59 y.o.  35.3K
                                CARMEN
                                                                                         53%
                             CITY OF                           258.6K                   19-59 y.o.              280.7K
                             PANABO
                                                                                          12%
                                                                              57.9K     13-18 y.o.  60.6K
                 DAVAO DEL SUR
     COTABATO                                                                            22%
      (NORTH                       ISLAND                                 105.9K        3-12 y.o.    112.9K
     COTABATO)                    GARDEN CITY
                                   OF SAMAL        DAVAO                                  7%
                                                  ORIENTAL
                                                                               32.1K    0-2 y.o.  33.9K
                               Talikud
                                Is.                            Vulnerable groups (based on DSWD-NHTS database)
                                               Conditional Cash Transfer
                                    Davao Gulf  programming beneficiaries
    Legend                                          59,189     Female   23       178        887      3,312    3,214
                                                    Households   Male   57       308       1,213     1,320    3,166
       Province capital                                              Child-headed  Single-headed  Poor individuals  Solo parent  Poor individuals
       Poverty incidence (%)  </= 10  11 - 30  31 - 50  51 - 60  61 - 84  households  households  w/ disability  =>18 years old  =>65 years old


       WATER, SANITATION AND HYGIENE            Source: PSA 2015/2010 Census  SHELTER                       Source: PSA 2015 Census
    Water                                                     Roof/Wall material
    supply
                                                                     230,520                   Roof
                                                                    Housing units

        Faucet                                                                        Strong       Light      Salvaged
       community   Tubed;   Dug            Natural
        system   piped    well    Bottled  sources  Others
       25.3%   13.9%     2.2%    23.3%    9.5%    25.7%                        Strong  51.7%       0.3%       0.0%
    Toilets (based on census 2010)
                                                                       Wall
                                                                               Light  36.9%        9.9%       0.1%
              88.9%       3.0%             4.6%       3.5%
                                                                               Salvaged  0.1%      0.0%       0.0%

     Water-sealed     None         Closed pit     Open pit
       EDUCATION            Source: DepEd 2016  NUTRITION             Source: FNRI 2013/2015  HEALTH  Source: DOH (Personnel 2016/Facilities 2017)

                                            Malnutrition  (0-60 months old)        Personnel
                     294
                     Primary schools

         86,921          79,246
         Male primary    Female primary      34.3%        26.7%       7.8%*         124      564       285      15
         school students  school students
                                              Stunting   Underweight   Wasting      Midwives  Nurses  Doctors  Dentists
                                              * Estimates with coefficient of variation greater than 20
                                                                                   Facilities
                      67                    Food
                      Secondary schools
                                            insecurity
             30,527      31,586             (households)  13.4%  38.5% 18.3%
             Male secondary   Female secondary                                        228         13         17
             school students  school students          Mild   Moderate  Severe
                                                                                   Barangay health  Rural health  Hospitals
                                                                                      stations    units  (government/private)
   The boundaries and names shown and the designations used on this map do not imply official endorsement or acceptance by the United Nations.                                    Creation date: February 2018
   Sources: PSA, DOH, NAMRIA, FNRI, DepEd, DSWD        Feedback: addawe@un.org, aportol@un.org, mendoza1@un.org     www.unocha.org/philippines     www.reliefweb.int      philippines.humanitarianresponse.info
   75   76   77   78   79   80   81   82   83   84   85