Page 84 - OCHA_PHL_Provincial_Profiles_2018
P. 84

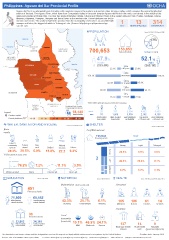
Philippines: Agusan del Sur Provincial Profile
             Agusan del Sur is an elongated basin formation with mountain ranges in the eastern and western sides forming a valley, which occupies the central longitudinal
             section of the land. The Agusan River, which flows from Compostela Valley in the south towards Agusan del Norte in the north, runs almost in the middle of the
             valley and empties at Butuan Bay. The river has twelve tributaries: Wawa, Gibong and Simulao Rivers in the eastern side and Ojot, Pusilao, Kasilayan, Libang,
                           SURIGAO
             Maasam, Adgawan, Cawayan, Umayam and Ihaon Rivers in the western side. These tributaries are fed by
                           DEL NORTE
             streams and creeks. The southern half of the province from the municipality of Veruela is an area filled with   1  13  314
             swamps and lakes, the biggest of which is Talacogon Lake. (Source: http://pia.gov.ph/provinces/agu-
             san-del-sur)                                                             CITY   MUNICIPALITIES  BARANGAYS
                                                                 POPULATION                            Source: PSA 2015 & 2010 Census / DSWD

                 Butuan Bay                                                                               72.9%
                                                                                                        27.1%
      Gingoog Bay     AGUSAN    SIBAGAT
                        DEL               SURIGAO               700,653              153,653
                      NORTE               DEL SUR                                    households        Urban / Rural

      MISAMIS                   CITY OF
      ORIENTAL                 BAYUGAN                               47.9%                          52.1 %
                                                                      female                              male
                                   PROSPERIDAD     Lianga Bay
                   ESPERANZA                                         (335.5K)            6%            (365.1K)
                                                                               22.1K   > 60 years  20.8K
                                    SAN FRANCISCO                                        48%
                      SAN LUIS                                 159.1K                 19-59 years               178.3K
                               TALACOGON
                                        ROSARIO
                                                                                         13%
                                                                             42.3K    13-18 years  45.8K
                         LA PAZ
                                        BUNAWAN                                          25%
                                                                        85.8K          3-12 years      92.1K
       BUKIDNON               LORETO
                                             TRENTO                                      8%
                                    VERUELA
                                         SANTA                                26.1K    < 2 years  27.9K
                                        JOSEFA
                                                               Vulnerable groups (based on DSWD-NHTS database)
                                  COMPOSTELA
                        DAVAO        VALLEY    Conditional Cash Transfer
                         DEL                   Programming Beneficiaries
                        NORTE
    Legend                                          58,440     Female   25       337      2,604     4,432     6,463
                                                    households  Male    97      1,060     3,559     2,182     6,136
       Province capital
                                                                                                   solo parent
       Poverty incidence (%)  </= 10  11 - 30  31 - 50  51 - 60  61 - 84  child-headed  single-headed  poor individuals  =>18 years old  poor individuals
                                                                               households
                                                                                         w/ disability
                                                                      households
                                                                                                            =>65 years old
      WATER, SANITATION AND HYGEINE                             SHELTER
                                                Source: PSA 2015/2010 Census
                                                                                                            Source: PSA 2015 Census
    Water                                                     Roof/Wall material
    supply
                                                                     151,934                   Roof
                                                                    Housing units
        Faucet
       community   Tubed;   Dug            Natural                                    Strong       Light     Salvaged
        system   piped    well    Bottled  sources  Others
       29.3%   20.5%     5.9%    15.8%     22.2   6.3%                         Strong  23.5%      0.5%        0.0%
    Toilets (based on census 2010)
                                                                      Wall
                                                                               Light  44.3%       30.4%       0.1%
              78.2%       7.2%           11.1%       3.5%
                                                                               Salvaged  0.2%     0.2%        0.1%
     Water-sealed    None          Closed pit     Open pit
      EDUCATION            Source: DepEd 2016  NUTRITION             Source: FNRI 2013/2015  HEALTH  Source: DOH (Personnel 2016/Facilities 2017)

                                            Malnutrition  (0-60 months old)        Personnel
                     451
                     Primary schools

         71,800         65,552
         Male primary   Female primary       42.3%       25.7%        6.1%          165      196       61       14
         school students  school students
                                              Stunting   Underweight  Wasting      Midwives  Nurses   Doctors  Dentists
                                                                                   Facilities
                     96                     Food
                     Secondary schools
                                            insecurity
            22,862       24,318             (households)  10.1%  46.3% 24.1%
            Male secondary   Female secondary                                         137         14          9
            school students  school students           Mild   Moderate  Severe
                                                                                   Barangay health  Rural health  Hospitals
                                                                                     stations     units  (government/private)
  The boundaries and names shown and the designations used on this map do not imply official endorsement or acceptance by the United Nations.                                    Creation date: January 2018
  Sources: PSA, DOH, NAMRIA, FNRI, DepEd, DSWD        Feedback: addawe@un.org, aportol@un.org, mendoza1@un.org     www.unocha.org/philippines     www.reliefweb.int      philippines.humanitarianresponse.info
   79   80   81   82   83   84   85   86   87   88   89