
Page 27 - BACC Report On-line EB 2017
P. 27
Draft Report on European Baccalaureate 2017
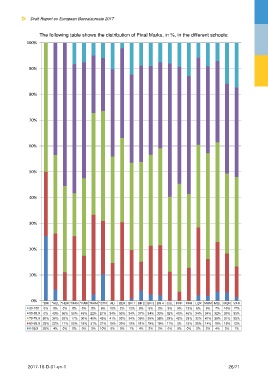
The following table shows the distribution of Final Marks, in %, in the different schools:
100%
90%
80%
70%
60%
50%
40%
30%
20%
10%
0%
*BRI *HEL *HER *MAN *PAR *RHM *STR ALI BER BR 1 BR 2 BR 3 BR 4 CUL FRF KAR LUX MAM MOL MUN VAR
90-100 0% 0% 0% 8% 8% 5% 6% 10% 2% 12% 9% 9% 8% 8% 9% 13% 6% 9% 7% 16% 17%
80-89,9 0% 43% 56% 50% 45% 22% 21% 34% 35% 34% 37% 34% 33% 52% 45% 46% 34% 34% 32% 35% 35%
70-79,9 50% 30% 33% 17% 30% 40% 43% 41% 33% 34% 39% 35% 38% 29% 42% 29% 32% 41% 39% 31% 35%
60-69,9 25% 22% 11% 25% 18% 31% 21% 15% 30% 19% 11% 19% 19% 11% 3% 13% 26% 14% 19% 15% 12%
0-59,9 25% 4% 0% 0% 0% 2% 10% 0% 0% 1% 4% 2% 2% 0% 0% 0% 2% 2% 4% 3% 1%
2017-10-D-01-en-1 26/71