
Page 28 - BACC Report On-line EB 2017
P. 28
Draft Report on European Baccalaureate 2017
Breakdown of final results throughout the past five years
100%
90%
80%
70%
60%
50%
40%
30%
20%
10%
0%
2013 2014 2015 2016 2017
90-100 6,70% 7,20% 8,40% 9,71% 9,34%
80-89,9 35,60% 32,90% 36,60% 36,50% 35,34%
70-79,9 35,60% 38,10% 33,90% 34,38% 35,64%
60-69,9 19,90% 20,10% 19,50% 17,56% 17,42%
0-59,9 2,20% 1,70% 1,70% 1,86% 2,26%
4.3 The Preliminary Marks
The preliminary mark (C mark) is made up of the following:
▪ Class marks (A marks) : They will account for 20 marks out of 50
▪ Part examination marks (B marks): They will account for 30 marks out of 50.
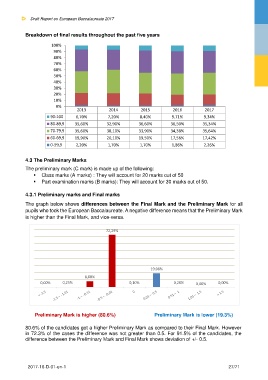
4.3.1 Preliminary marks and Final marks
The graph below shows differences between the Final Mark and the Preliminary Mark for all
pupils who took the European Baccalaureate. A negative difference means that the Preliminary Mark
is higher than the Final Mark, and vice-versa.
72,29%
19,08%
8,08%
0,00% 0,25% 0,10% 0,20% 0,00% 0,00%
Preliminary Mark is higher (80.6%) Preliminary Mark is lower (19.3%)
80.6% of the candidates got a higher Preliminary Mark as compared to their Final Mark. However
in 72.3% of the cases the difference was not greater than 0.5. For 91.5% of the candidates, the
difference between the Preliminary Mark and Final Mark shows deviation of +/- 0.5.
2017-10-D-01-en-1 27/71