
Page 41 - EPSI Magazine Issue 8 final 2018.indd
P. 41
38
hazards. However, in mapping Various Field opera-
tions we can use flying sensor technology to gather
on-demand high resolution imagery across a field
location in order to survey a site. This allows regular
monitoring of potential sites to help identify and
manage change, without having to commission
expensive satellite data capture reducing the need
to deploy staff, increase safety and continuation of
productivity.
GIS Automation in Map Production and Visu-
alization: can be crucially used for environmental
Impact Assessments; for suitability of pipelines &
pump stations, for historical exploration areas, for
directional drilling among others. It can also apply
in the incident of Environmental monitoring when
the focus currently on shale play to development,
it is essential to accurately monitor environmental
changes associated with oil and gas operations.
IT/GIS is invaluable in this regard, because it inte-
grates and visualises time stamped data against a
base lined case, e.g. using regularly updated DEMs
to help predict subsidence the extraction of the re-
sources will cause.
Wind, Solar and Biomass.
Here mapping starts with the identification
of physical resources, naturally occurring circum-
stances which need to be: understood, managed
and considered more closely if they are to be op-
timised. IT/GIS is the best tool to analyze and com-
municate optimal energy sites for these renewable
resources. It provides the means to convert long- topographic information available and IT is always
term weather observations of wind and sun to a ready for this task.
map view, returning calibrated maps that show the
best sites for renewable power generation invest- Similarly, Solar mapping at a global scale was
ments. undertaken by NASA for the Group on Earth Ob-
servations solar collectors are best oriented to the
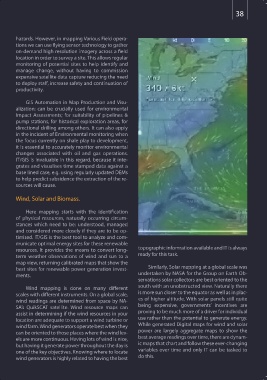
Wind mapping is done on many different south with an unobstructed view. Naturally there
scales with different instruments. On a global scale, is more sun closer to the equator as well as in plac-
wind readings are determined from space by NA- es of higher altitude. With solar panels still quite
SA’s QuikSCAT satellite. Wind resource maps can being expensive, governments’ incentives are
assist in determining if the wind resources in your proving to be much more of a driver for individual
location are adequate to support a wind turbine or use rather than the potential to generate energy.
wind farm. Wind generators operate best when they While generated Digital maps for wind and solar
can be oriented to those places where the wind lev- power are largely aggregate maps to show the
els are more continuous. Having lots of wind is nice, best average readings over time, there are dynam-
but having it generate power throughout the day is ic maps that chart and follow these ever-changing
one of the key objectives. Knowing where to locate variables over time and only IT can be tasked to
wind generators is highly related to having the best do this.