
Page 22 - bne IntelliNews Country Report: Belarus Dec17
P. 22
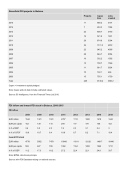
Greenfield   FDI   projects   in   Belarus
Projects Capex Jobs €mn created
2015 11 688.2 3191
2014 7 263.3 1064
2013 22 808.7 3793
2012 16 521.9 1631
2011 29 874.9 3304
2010 36 1511.3 4872
2009 22 945.2 4905
2008 28 846.7 5054
2007 16 332.2 1592
2006 15 708.7 1566
2005 11 681.7 3624
2004 10 192.1 466
2003 15 755.1 1750
Total 238 9130.2 36812
Capex   =   investment   capital   pledged.
Note:   Capex   and   job   data   include   estimated   values. Source:   fDi   Intelligence,   from   the   Financial   Times   Ltd   2016.
FDI   inflow   and   inward   FDI   stock   in   Belarus,   2008-2015
FDI   inflow
2008 2009 2010 2011 2012 2013 2014 2015
EUR   million 1544 1321 1041 2787 1110 1690 1418 1444
EUR   per   capita 162 139 110 294 117 179 150 152
In   %   ofGDP 3.6 3.8 2.5 7.6 2.3 3.1 2.4 3
In   %   of   GFCF 10.9 10.7 6.4 19.8 6.7 8.2 7.1 10.4
Inward   FDI   stock
EUR   million 4778 5952 7479 10048 11011 12120 14617 16440
EUR   per   capita 502 627 789 1062 1164 1280 1542 1731
In   %   of   GDP 11.2 17.3 18.2 27.2 22.4 22.1 24.8 33.7
Note:   BPM6,   directional   principle.
Source:   wiiw   FDI   Database   relying   on   national   sources.
22BELARUSC t R tD b 2017 itlli
