
Page 12 - Caucasus Outlook 2025
P. 12
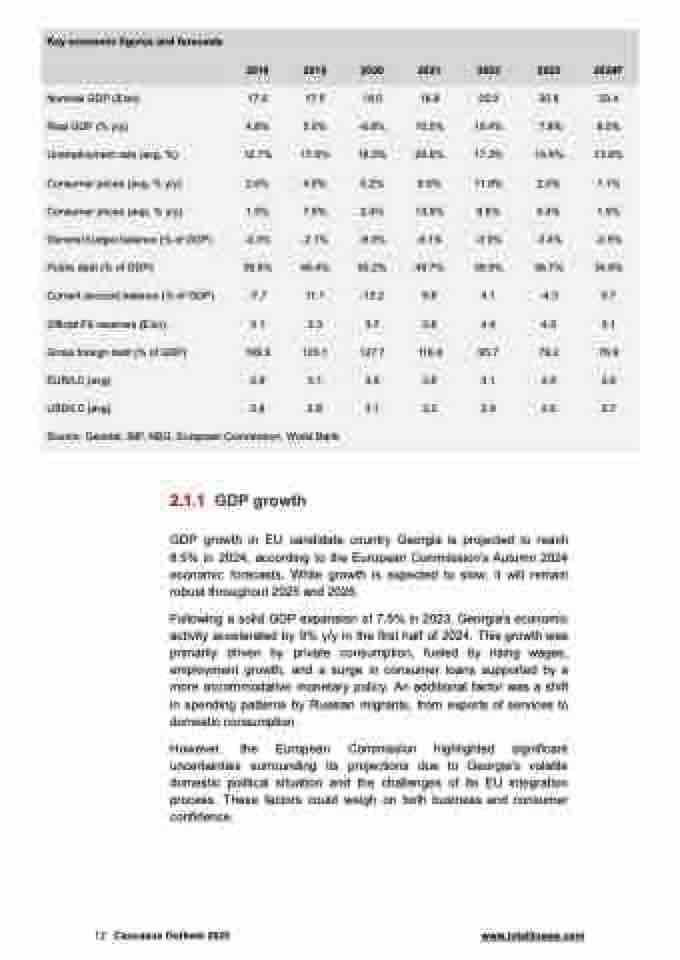
  Key economic figures and forecasts
 2018 2019 2020 2021 2022 2023 2024F
 Nominal GDP ($ bn) 17.6 17.5 16.0 18.9 25.0 30.8 33.4
 Real GDP (% y/y) 4.8% 5.0% -6.8% 10.5% 10.4% 7.8% 8.5%
 Unemployment rate (avg, %) 12.7% 17.6% 18.5% 20.6% 17.3% 16.4% 13.8%
 Consumer prices (avg, % y/y) 2.6% 4.9% 5.2% 9.6% 11.9% 2.5% 1.1%
 Consumer prices (eop, % y/y) 1.5% 7.0% 2.4% 13.9% 9.8% 0.4% 1.9%
 General budget balance (% of GDP) -2.3% -2.1% -9.3% -6.1% -3.0% -3.4% -2.5%
 Public debt (% of GDP) 38.9% 40.4% 60.2% 49.7% 39.5% 36.7% 34.6%
 Current account balance (% of GDP) -7.7 11.1 -13.2 9.8 4.1 -4.3 0.7
 Official FX reserves ($ bn) 3.1 3.3 3.7 3.8 4.4 4.6 3.1
 Gross foreign debt (% of GDP) 109.9 105.1 127.7 116.8 95.7 79.2 76.9
 EUR/LC (avg) 2.9 3.1 3.6 3.8 3.1 2.8 2.9
 USD/LC (avg) 2.8 2.8 3.1 3.2 2.9 2.6 2.7 Source: Geostat, IMF, NBG, European Commission, World Bank
   2.1.1 GDP growth
GDP growth in EU candidate country Georgia is projected to reach 8.5% in 2024, according to the European Commission’s Autumn 2024 economic forecasts. While growth is expected to slow, it will remain robust throughout 2025 and 2026.
Following a solid GDP expansion of 7.5% in 2023, Georgia’s economic activity accelerated by 9% y/y in the first half of 2024. This growth was primarily driven by private consumption, fueled by rising wages, employment growth, and a surge in consumer loans supported by a more accommodative monetary policy. An additional factor was a shift in spending patterns by Russian migrants, from exports of services to domestic consumption.
However, the European Commission highlighted significant uncertainties surrounding its projections due to Georgia’s volatile domestic political situation and the challenges of its EU integration process. These factors could weigh on both business and consumer confidence.
  12 Caucasus Outlook 2025 www.intellinews.com
