
Page 21 - UKRRptOct18
P. 21
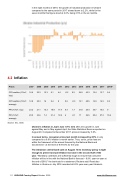
in the eight months of 2018, the growth of industrial production in Ukraine compared to the same period in 2017 slowed down to 2.2%, while for the seven months this figure stood at 2.6%, being 2.5% in the six months.
4.2  Inflation
Prices 2007 2008 2009 2010 2011 2012 2013 2014 2015 2016 2017 2018F
CPI headline (%YoY, 16.6 22.3 12.3 9.1 4.6 -0.2 0.5 24.9 43.3 12.4 13.7 9.4 eop)
CPI headline (%YoY, 12.8 25.3 16 9.4 8 0.6 -0.3 12.1 48.5 14.9 14.5 9.2 average)
PPI (%YoY, eop) 23.2 21.1 15.3 18.8 17.4 0.4 1.7 31.8 25.4 35.7 16.5 9
PPI (%YoY, 20.5 33.6 7.4 21.4 19.9 6 -0.1 17 36.5 20.4 27.2 10.6 average)
Source: ICU, CEIC
Ukraine’s inflation in July's was -0.7% m/m  after zero growth in June against May and in May against April, the State Statistical Service reported on August 20. Compared to December 2017, prices increased by 3.6%.
In annual terms, consumer prices last month increased by 8.9%  in July compared to a 9.9% inflation a month earlier. Thus, so far, price rises are within the framework of the annual forecast by the National Bank and Government - at the level of 8.9-9.0% for the year.
The Ukrainian central bank said on August 13 its monetary policy is tight enough to prevent annual inflation increase in the second half of the year . "Monetary conditions are sufficiently tough to ensure that consumer inflation will be in line with the National Bank's forecast – 8.9% year-on-year at the end of 2018," the bank said in a statement, Reuters said. Read also Inflation in Ukraine in July 2018 recorded at 8.9% year-over-year Ukraine's
21  UKRAINE Country Report  October 2018    www.intellinews.com
