
Page 7 - LICENSE TO CARRY
P. 7
7
Firearm theft statistics
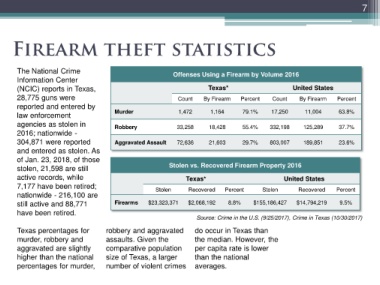
The National Crime Offenses Using a Firearm by Volume 2016
Information Center
(NCIC) reports in Texas, Texas* United States
28,775 guns were Count By Firearm Percent Count By Firearm Percent
reported and entered by
law enforcement Murder 1,472 1,164 79.1% 17,250 11,004 63.8%
agencies as stolen in Robbery 33,258 18,428 55.4% 332,198 125,289 37.7%
2016; nationwide -
304,871 were reported Aggravated Assault 72,636 21,603 29.7% 803,007 189,851 23.6%
and entered as stolen. As
of Jan. 23, 2018, of those
stolen, 21,598 are still Stolen vs. Recovered Firearm Property 2016
active records, while Texas* United States
7,177 have been retired; Stolen Recovered Percent Stolen Recovered Percent
nationwide - 216,100 are
still active and 88,771 Firearms $23,323,371 $2,068,192 8.8% $155,186,427 $14,794,219 9.5%
have been retired.
Source: Crime in the U.S. (9/25/2017), Crime in Texas (10/30/2017)
Texas percentages for robbery and aggravated do occur in Texas than
murder, robbery and assaults. Given the the median. However, the
aggravated are slightly comparative population per capita rate is lower
higher than the national size of Texas, a larger than the national
percentages for murder, number of violent crimes averages.