
Page 211 - The Power of Light, Colour and Sound for Health and Wellness draft
P. 211
water changes, are windows into the structural organization of water matrix, places where we can measure how much of light was absorb and identify which water species are affected by perturbation and how.
For example, by using a simple subtraction technique, one can easily visualize the changes in water spectra caused by consecutive illuminations (Figure 7). From these difference spectra presented in Figure 7, one can clearly observe that light infuences the water – shining light on water changes the water structure and this change is refected in their spectra – clearly at some wavelengths more than others i.e. some water species are more infuenced then others and different waters react differently.
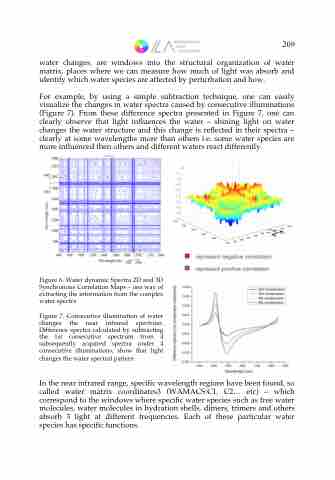
Figure 6. Water dynamic Spectra 2D and 3D Synchronous Correlation Maps – one way of extracting the information from the complex water spectra
Figure 7. Consecutive illumination of water changes the near infrared spectrum. Difference spectra calculated by subtracting the 1st consecutive spectrum from 4 subsequently acquired spectra under 4 consecutive illuminations, show that light changes the water spectral pattern
In the near infrared range, specifc wavelength regions have been found, so called water matrix coordinates3 (WAMACS:C1, C2... etc) – which correspond to the windows where specifc water species such as free water molecules, water molecules in hydration shells, dimers, trimers and others absorb 3 light at different frequencies. Each of these particular water species has specifc functions.
209
