Page 115 - NobleCon19revC2_Neat
P. 115

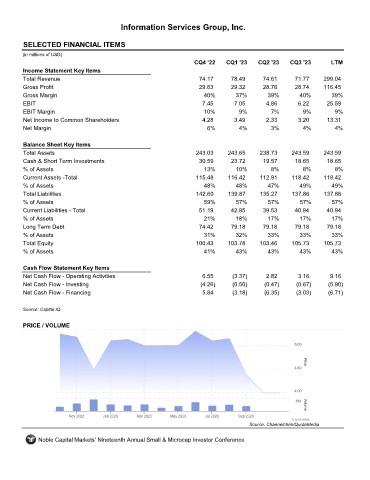
Information Services Group, Inc.


       SELECTED FINANCIAL ITEMS                                III

      (in millions of USD)
                                                                  CQ4 '22    CQ1 '23    CQ2 '23    CQ3 '23        LTM
       Income Statement Key Items
       Total Revenue                                                74.17      78.49      74.61      71.77     299.04
       Gross Profit                                                 29.63      29.32      28.76      28.74     116.45
       Gross Margin                                                  40%         37%        39%        40%        39%
       EBIT                                                          7.45       7.05       4.86       6.22      25.59
       EBIT Margin                                                    10%         9%         7%         9%         9%
       Net Income to Common Shareholders                             4.28       3.49       2.33       3.20      13.31
       Net Margin                                                      6%         4%         3%         4%         4%


       Balance Sheet Key Items
       Total Assets                                                243.03     243.65     238.73     243.59     243.59
       Cash & Short Term Investments                                30.59      23.72      19.57      18.65      18.65
       % of Assets                                                    13%        10%         8%         8%         8%
       Current Assets -Total                                       115.48     116.42     112.91     118.42     118.42
       % of Assets                                                    48%        48%        47%        49%        49%
       Total Liabilities                                           142.60     139.87     135.27     137.86     137.86
       % of Assets                                                    59%        57%        57%        57%        57%
       Current Liabilities - Total                                  51.19      42.95      39.53      40.94      40.94
       % of Assets                                                   21%         18%        17%        17%        17%
       Long Term Debt                                               74.42      79.18      79.18      79.18      79.18
       % of Assets                                                   31%         32%        33%        33%        33%
       Total Equity                                                100.43     103.78     103.46     105.73     105.73
       % of Assets                                                    41%        43%        43%        43%        43%


       Cash Flow Statement Key Items
       Net Cash Flow - Operating Activities                          6.55      (3.37)      2.82       3.16       9.16
       Net Cash Flow - Investing                                    (4.26)     (0.50)      (0.47)     (0.67)     (5.90)
       Net Cash Flow - Financing                                     5.84      (3.18)      (6.35)     (3.03)     (6.71)


      Source: Capital IQ

       PRICE / VOLUME


                                                                                     Source: Channelchek/QuoteMedia

            Noble Capital Markets' Nineteenth Annual Small & Microcap Investor Conference
   110   111   112   113   114   115   116   117   118   119   120