
Page 117 - NobleCon19revC2_Neat
P. 117
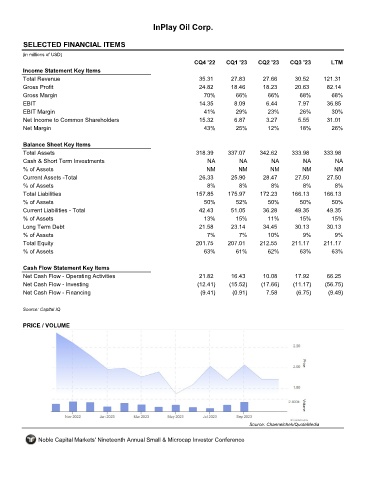
InPlay Oil Corp.


       SELECTED FINANCIAL ITEMS                                IPOOF

      (in millions of USD)
                                                                  CQ4 '22    CQ1 '23    CQ2 '23    CQ3 '23        LTM
       Income Statement Key Items
       Total Revenue                                                35.31      27.83      27.66      30.52     121.31
       Gross Profit                                                 24.82      18.46      18.23      20.63      82.14
       Gross Margin                                                  70%         66%        66%        68%        68%
       EBIT                                                         14.35       8.09       6.44       7.97      36.85
       EBIT Margin                                                    41%        29%        23%        26%        30%
       Net Income to Common Shareholders                            15.32       6.87       3.27       5.55      31.01
       Net Margin                                                     43%        25%        12%        18%        26%


       Balance Sheet Key Items
       Total Assets                                                318.39     337.07     342.62     333.98     333.98
       Cash & Short Term Investments                                   NA         NA         NA         NA         NA
       % of Assets                                                    NM          NM         NM         NM         NM
       Current Assets -Total                                        26.33      25.90      28.47      27.50      27.50
       % of Assets                                                     8%         8%         8%         8%         8%
       Total Liabilities                                           157.85     175.97     172.23     166.13     166.13
       % of Assets                                                    50%        52%        50%        50%        50%
       Current Liabilities - Total                                  42.43      51.05      36.28      49.35      49.35
       % of Assets                                                   13%         15%        11%        15%        15%
       Long Term Debt                                               21.58      23.14      34.45      30.13      30.13
       % of Assets                                                     7%         7%        10%         9%         9%
       Total Equity                                                201.75     207.01     212.55     211.17     211.17
       % of Assets                                                    63%        61%        62%        63%        63%


       Cash Flow Statement Key Items
       Net Cash Flow - Operating Activities                         21.82      16.43      10.08      17.92      66.25
       Net Cash Flow - Investing                                   (12.41)    (15.52)    (17.66)     (11.17)    (56.75)
       Net Cash Flow - Financing                                    (9.41)     (0.91)      7.58       (6.75)     (9.49)


      Source: Capital IQ

       PRICE / VOLUME


                                                                                     Source: Channelchek/QuoteMedia

            Noble Capital Markets' Nineteenth Annual Small & Microcap Investor Conference