
Page 121 - NobleCon19revC2_Neat
P. 121
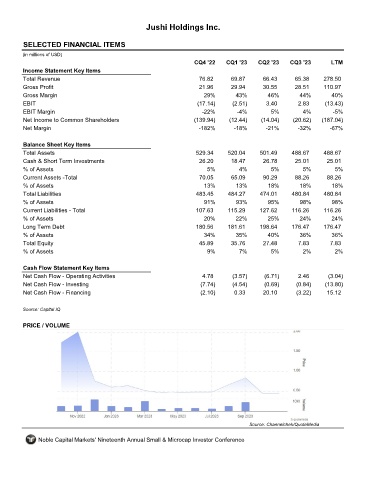
Jushi Holdings Inc.


       SELECTED FINANCIAL ITEMS                                JUSH.F

      (in millions of USD)
                                                                  CQ4 '22    CQ1 '23    CQ2 '23    CQ3 '23        LTM
       Income Statement Key Items
       Total Revenue                                                76.82      69.87      66.43      65.38     278.50
       Gross Profit                                                 21.96      29.94      30.55      28.51     110.97
       Gross Margin                                                  29%         43%        46%        44%        40%
       EBIT                                                        (17.14)     (2.51)      3.40       2.83      (13.43)
       EBIT Margin                                                   -22%        -4%         5%         4%        -5%
       Net Income to Common Shareholders                          (139.94)    (12.44)    (14.04)     (20.62)   (187.04)
       Net Margin                                                   -182%       -18%       -21%       -32%       -67%


       Balance Sheet Key Items
       Total Assets                                                529.34     520.04     501.49     488.67     488.67
       Cash & Short Term Investments                                26.20      18.47      26.78      25.01      25.01
       % of Assets                                                     5%         4%         5%         5%         5%
       Current Assets -Total                                        70.05      65.09      90.29      88.26      88.26
       % of Assets                                                    13%        13%        18%        18%        18%
       Total Liabilities                                           483.45     484.27     474.01     480.84     480.84
       % of Assets                                                    91%        93%        95%        98%        98%
       Current Liabilities - Total                                 107.63     115.29     127.62     116.26     116.26
       % of Assets                                                   20%         22%        25%        24%        24%
       Long Term Debt                                              180.56     181.61     198.64     176.47     176.47
       % of Assets                                                   34%         35%        40%        36%        36%
       Total Equity                                                 45.89      35.76      27.48       7.83       7.83
       % of Assets                                                     9%         7%         5%         2%         2%


       Cash Flow Statement Key Items
       Net Cash Flow - Operating Activities                          4.78      (3.57)      (6.71)     2.46       (3.04)
       Net Cash Flow - Investing                                    (7.74)     (4.54)      (0.69)     (0.84)    (13.80)
       Net Cash Flow - Financing                                    (2.10)      0.33      20.10       (3.22)    15.12


      Source: Capital IQ

       PRICE / VOLUME


                                                                                     Source: Channelchek/QuoteMedia

            Noble Capital Markets' Nineteenth Annual Small & Microcap Investor Conference