
Page 177 - NobleCon19revC2_Neat
P. 177
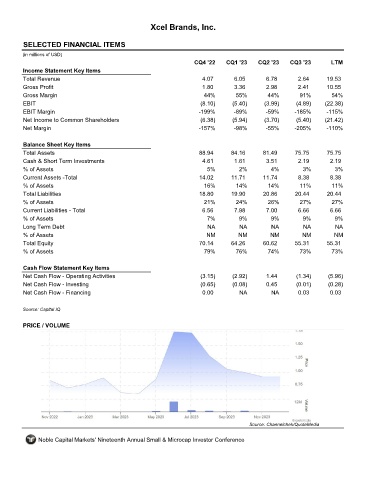
Xcel Brands, Inc.


       SELECTED FINANCIAL ITEMS                                XELB

      (in millions of USD)
                                                                  CQ4 '22    CQ1 '23    CQ2 '23    CQ3 '23        LTM
       Income Statement Key Items
       Total Revenue                                                 4.07       6.05       6.78       2.64      19.53
       Gross Profit                                                  1.80       3.36       2.98       2.41      10.55
       Gross Margin                                                  44%         55%        44%        91%        54%
       EBIT                                                         (8.10)     (5.40)      (3.99)     (4.89)    (22.38)
       EBIT Margin                                                  -199%       -89%       -59%      -185%      -115%
       Net Income to Common Shareholders                            (6.38)     (5.94)      (3.70)     (5.40)    (21.42)
       Net Margin                                                   -157%       -98%       -55%      -205%      -110%


       Balance Sheet Key Items
       Total Assets                                                 88.94      84.16      81.49      75.75      75.75
       Cash & Short Term Investments                                 4.61       1.61       3.51       2.19       2.19
       % of Assets                                                     5%         2%         4%         3%         3%
       Current Assets -Total                                        14.02      11.71      11.74       8.38       8.38
       % of Assets                                                    16%        14%        14%        11%        11%
       Total Liabilities                                            18.80      19.90      20.86      20.44      20.44
       % of Assets                                                    21%        24%        26%        27%        27%
       Current Liabilities - Total                                   6.56       7.98       7.00       6.66       6.66
       % of Assets                                                     7%         9%         9%         9%         9%
       Long Term Debt                                                  NA         NA         NA         NA         NA
       % of Assets                                                    NM          NM         NM         NM         NM
       Total Equity                                                 70.14      64.26      60.62      55.31      55.31
       % of Assets                                                    79%        76%        74%        73%        73%


       Cash Flow Statement Key Items
       Net Cash Flow - Operating Activities                         (3.15)     (2.92)      1.44       (1.34)     (5.96)
       Net Cash Flow - Investing                                    (0.65)     (0.08)      0.45       (0.01)     (0.28)
       Net Cash Flow - Financing                                     0.00         NA         NA       0.03       0.03


      Source: Capital IQ

       PRICE / VOLUME


                                                                                     Source: Channelchek/QuoteMedia

            Noble Capital Markets' Nineteenth Annual Small & Microcap Investor Conference