
Page 175 - NobleCon19revC2_Neat
P. 175
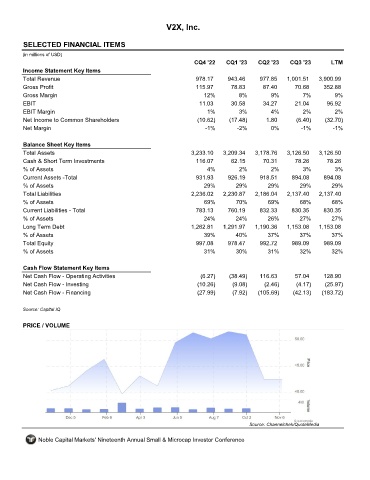
V2X, Inc.


       SELECTED FINANCIAL ITEMS                                VVX

      (in millions of USD)
                                                                  CQ4 '22    CQ1 '23    CQ2 '23    CQ3 '23        LTM
       Income Statement Key Items
       Total Revenue                                               978.17     943.46     977.85   1,001.51    3,900.99
       Gross Profit                                                115.97      78.83      87.40      70.68     352.88
       Gross Margin                                                  12%          8%         9%         7%         9%
       EBIT                                                         11.03      30.58      34.27      21.04      96.92
       EBIT Margin                                                     1%         3%         4%         2%         2%
       Net Income to Common Shareholders                           (10.62)    (17.48)      1.80       (6.40)    (32.70)
       Net Margin                                                     -1%        -2%         0%        -1%        -1%


       Balance Sheet Key Items
       Total Assets                                              3,233.10   3,209.34   3,178.76   3,126.50    3,126.50
       Cash & Short Term Investments                               116.07      62.15      70.31      78.26      78.26
       % of Assets                                                     4%         2%         2%         3%         3%
       Current Assets -Total                                       931.93     926.19     918.51     894.08     894.08
       % of Assets                                                    29%        29%        29%        29%        29%
       Total Liabilities                                         2,236.02   2,230.87   2,186.04   2,137.40    2,137.40
       % of Assets                                                    69%        70%        69%        68%        68%
       Current Liabilities - Total                                 783.13     760.19     832.33     830.35     830.35
       % of Assets                                                   24%         24%        26%        27%        27%
       Long Term Debt                                            1,262.81   1,291.97   1,190.36   1,153.08    1,153.08
       % of Assets                                                   39%         40%        37%        37%        37%
       Total Equity                                                997.08     978.47     992.72     989.09     989.09
       % of Assets                                                    31%        30%        31%        32%        32%


       Cash Flow Statement Key Items
       Net Cash Flow - Operating Activities                         (6.27)    (38.49)    116.63      57.04     128.90
       Net Cash Flow - Investing                                   (10.26)     (9.08)      (2.46)     (4.17)    (25.97)
       Net Cash Flow - Financing                                   (27.99)     (7.92)   (105.69)     (42.13)   (183.72)


      Source: Capital IQ

       PRICE / VOLUME


                                                                                     Source: Channelchek/QuoteMedia

            Noble Capital Markets' Nineteenth Annual Small & Microcap Investor Conference