Page 171 - NobleCon19revC2_Neat
        P. 171
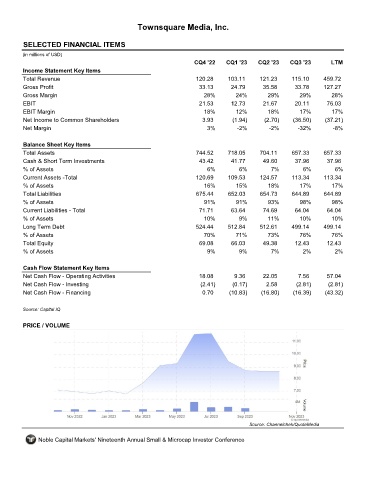
     Townsquare Media, Inc.
       SELECTED FINANCIAL ITEMS                                TSQ
      (in millions of USD)
                                                                  CQ4 '22    CQ1 '23    CQ2 '23    CQ3 '23        LTM
       Income Statement Key Items
       Total Revenue                                               120.28     103.11     121.23     115.10     459.72
       Gross Profit                                                 33.13      24.79      35.58      33.78     127.27
       Gross Margin                                                  28%         24%        29%        29%        28%
       EBIT                                                         21.53      12.73      21.67      20.11      76.03
       EBIT Margin                                                    18%        12%        18%        17%        17%
       Net Income to Common Shareholders                             3.93      (1.94)      (2.70)    (36.50)    (37.21)
       Net Margin                                                      3%        -2%        -2%       -32%        -8%
       Balance Sheet Key Items
       Total Assets                                                744.52     718.05     704.11     657.33     657.33
       Cash & Short Term Investments                                43.42      41.77      49.60      37.96      37.96
       % of Assets                                                     6%         6%         7%         6%         6%
       Current Assets -Total                                       120.69     109.53     124.57     113.34     113.34
       % of Assets                                                    16%        15%        18%        17%        17%
       Total Liabilities                                           675.44     652.03     654.73     644.89     644.89
       % of Assets                                                    91%        91%        93%        98%        98%
       Current Liabilities - Total                                  71.71      63.64      74.69      64.04      64.04
       % of Assets                                                   10%          9%        11%        10%        10%
       Long Term Debt                                              524.44     512.84     512.61     499.14     499.14
       % of Assets                                                   70%         71%        73%        76%        76%
       Total Equity                                                 69.08      66.03      49.38      12.43      12.43
       % of Assets                                                     9%         9%         7%         2%         2%
       Cash Flow Statement Key Items
       Net Cash Flow - Operating Activities                         18.08       9.36      22.05       7.56      57.04
       Net Cash Flow - Investing                                    (2.41)     (0.17)      2.58       (2.81)     (2.81)
       Net Cash Flow - Financing                                     0.70     (10.83)    (16.80)     (16.39)    (43.32)
      Source: Capital IQ
       PRICE / VOLUME
                                                                                     Source: Channelchek/QuoteMedia
            Noble Capital Markets' Nineteenth Annual Small & Microcap Investor Conference
     	
