Page 169 - NobleCon19revC2_Neat
P. 169

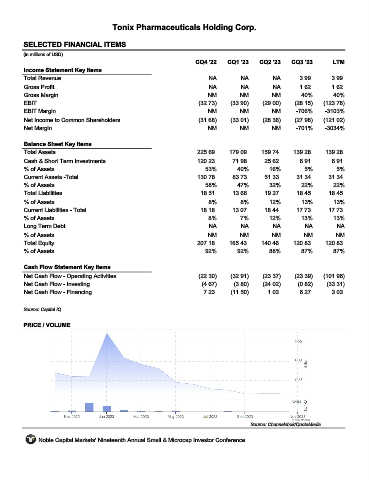
Tonix Pharmaceuticals Holding Corp.


         SELECTED FINANCIAL ITEMS                                 TNXP
         (in millions of USD)
                                                                     CQ4 '22    CQ1 '23    CQ2 '23    CQ3 '23       LTM
         Income Statement Key Items
         Total Revenue                                                   NA         NA         NA        3.99       3.99
         Gross Profit                                                    NA         NA         NA        1.62       1.62
         Gross Margin                                                    NM         NM         NM        40%        40%
         EBIT                                                         (32.73)    (33.90)    (29.00)    (28.15)   (123.78)
         EBIT Margin                                                     NM         NM         NM       -706%     -3103%
         Net Income to Common Shareholders                            (31.68)    (33.01)    (28.36)    (27.98)   (121.02)
         Net Margin                                                      NM         NM         NM       -701%     -3034%

         Balance Sheet Key Items
         Total Assets                                                225.69     179.09     159.74      139.28     139.28
         Cash & Short Term Investments                               120.23      71.98       25.62       6.91       6.91
         % of Assets                                                    53%        40%        16%          5%         5%
         Current Assets -Total                                       130.78       83.73      51.33      31.34      31.34
         % of Assets                                                    58%        47%        32%        22%         22%
         Total Liabilities                                            18.51       13.66      19.27      18.45      18.45
         % of Assets                                                     8%         8%        12%        13%         13%
         Current Liabilities - Total                                  18.18      13.07       18.44      17.73      17.73
         % of Assets                                                     8%         7%        12%        13%        13%
         Long Term Debt                                                  NA         NA         NA          NA         NA
         % of Assets                                                     NM         NM         NM         NM         NM
         Total Equity                                                207.18     165.43     140.46      120.83     120.83
         % of Assets                                                    92%        92%        88%        87%        87%

         Cash Flow Statement Key Items
         Net Cash Flow - Operating Activities                         (22.30)    (32.91)    (23.37)    (23.39)   (101.96)
         Net Cash Flow - Investing                                     (4.67)     (3.80)    (24.02)     (0.82)    (33.31)
         Net Cash Flow - Financing                                     7.23      (11.50)      1.03       6.27       3.03

         Source: Capital IQ


         PRICE / VOLUME


                                                                                        Source: Channelchek/QuoteMedia

              Noble Capital Markets' Nineteenth Annual Small & Microcap Investor Conference
   164   165   166   167   168   169   170   171   172   173   174