Page 165 - NobleCon19revC2_Neat
P. 165

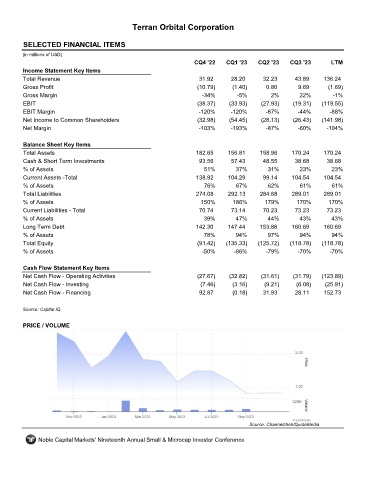
Terran Orbital Corporation


       SELECTED FINANCIAL ITEMS                                LLAP

      (in millions of USD)
                                                                  CQ4 '22    CQ1 '23    CQ2 '23    CQ3 '23        LTM
       Income Statement Key Items
       Total Revenue                                                31.92      28.20      32.23      43.89     136.24
       Gross Profit                                                (10.79)     (1.40)      0.80       9.69       (1.69)
       Gross Margin                                                  -34%        -5%         2%        22%        -1%
       EBIT                                                        (38.37)    (33.93)    (27.93)     (19.31)   (119.55)
       EBIT Margin                                                  -120%      -120%       -87%       -44%       -88%
       Net Income to Common Shareholders                           (32.98)    (54.45)    (28.13)     (26.43)   (141.98)
       Net Margin                                                   -103%      -193%       -87%       -60%      -104%


       Balance Sheet Key Items
       Total Assets                                                182.65     156.81     158.96     170.24     170.24
       Cash & Short Term Investments                                93.56      57.43      48.55      38.68      38.68
       % of Assets                                                    51%        37%        31%        23%        23%
       Current Assets -Total                                       138.92     104.29      99.14     104.54     104.54
       % of Assets                                                    76%        67%        62%        61%        61%
       Total Liabilities                                           274.08     292.13     284.68     289.01     289.01
       % of Assets                                                  150%        186%       179%       170%       170%
       Current Liabilities - Total                                  70.74      73.14      70.23      73.23      73.23
       % of Assets                                                   39%         47%        44%        43%        43%
       Long Term Debt                                              142.30     147.44     153.88     160.69     160.69
       % of Assets                                                   78%         94%        97%        94%        94%
       Total Equity                                                (91.42)   (135.33)   (125.72)   (118.78)    (118.78)
       % of Assets                                                   -50%       -86%       -79%       -70%       -70%


       Cash Flow Statement Key Items
       Net Cash Flow - Operating Activities                        (27.67)    (32.82)    (31.61)     (31.79)   (123.89)
       Net Cash Flow - Investing                                    (7.46)     (3.16)      (9.21)     (6.08)    (25.91)
       Net Cash Flow - Financing                                    92.87      (0.18)     31.93      28.11     152.73


      Source: Capital IQ

       PRICE / VOLUME


                                                                                     Source: Channelchek/QuoteMedia

            Noble Capital Markets' Nineteenth Annual Small & Microcap Investor Conference
   160   161   162   163   164   165   166   167   168   169   170