Page 161 - NobleCon19revC2_Neat
P. 161

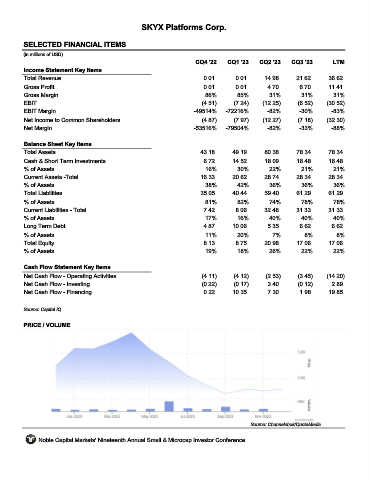
SKYX Platforms Corp.


       SELECTED FINANCIAL ITEMS                                SKYX

      (in millions of USD)
                                                                  CQ4 '22    CQ1 '23    CQ2 '23    CQ3 '23        LTM
       Income Statement Key Items
       Total Revenue                                                 0.01       0.01      14.98      21.62      36.62
       Gross Profit                                                  0.01       0.01       4.70       6.70      11.41
       Gross Margin                                                  86%         85%        31%        31%        31%
       EBIT                                                         (4.51)     (7.24)    (12.25)      (6.52)    (30.52)
       EBIT Margin                                                -49514%    -72216%       -82%       -30%       -83%
       Net Income to Common Shareholders                            (4.87)     (7.97)    (12.27)      (7.18)    (32.30)
       Net Margin                                                 -53516%    -79504%       -82%       -33%       -88%


       Balance Sheet Key Items
       Total Assets                                                 43.18      49.19      80.38      78.34      78.34
       Cash & Short Term Investments                                 6.72      14.52      18.09      16.48      16.48
       % of Assets                                                    16%        30%        22%        21%        21%
       Current Assets -Total                                        16.33      20.62      28.74      28.34      28.34
       % of Assets                                                    38%        42%        36%        36%        36%
       Total Liabilities                                            35.05      40.44      59.40      61.29      61.29
       % of Assets                                                    81%        82%        74%        78%        78%
       Current Liabilities - Total                                   7.42       8.06      32.48      31.33      31.33
       % of Assets                                                   17%         16%        40%        40%        40%
       Long Term Debt                                                4.87      10.06       5.35       6.62       6.62
       % of Assets                                                   11%         20%         7%         8%         8%
       Total Equity                                                  8.13       8.75      20.98      17.06      17.06
       % of Assets                                                    19%        18%        26%        22%        22%


       Cash Flow Statement Key Items
       Net Cash Flow - Operating Activities                         (4.11)     (4.12)      (2.53)     (3.45)    (14.20)
       Net Cash Flow - Investing                                    (0.22)     (0.17)      3.40       (0.12)     2.89
       Net Cash Flow - Financing                                     0.22      10.35       7.30       1.98      19.85


      Source: Capital IQ

       PRICE / VOLUME


                                                                                     Source: Channelchek/QuoteMedia

            Noble Capital Markets' Nineteenth Annual Small & Microcap Investor Conference
   156   157   158   159   160   161   162   163   164   165   166