Page 159 - NobleCon19revC2_Neat
P. 159

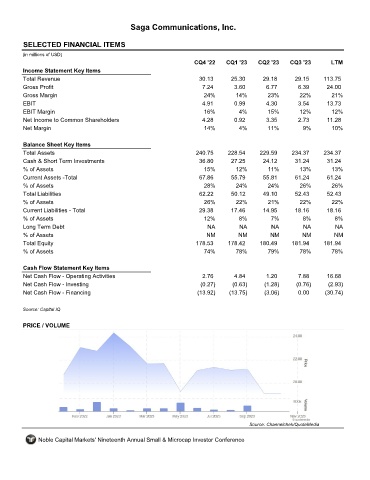
Saga Communications, Inc.


       SELECTED FINANCIAL ITEMS                                SGA

      (in millions of USD)
                                                                  CQ4 '22    CQ1 '23    CQ2 '23    CQ3 '23        LTM
       Income Statement Key Items
       Total Revenue                                                30.13      25.30      29.18      29.15     113.75
       Gross Profit                                                  7.24       3.60       6.77       6.39      24.00
       Gross Margin                                                  24%         14%        23%        22%        21%
       EBIT                                                          4.91       0.99       4.30       3.54      13.73
       EBIT Margin                                                    16%         4%        15%        12%        12%
       Net Income to Common Shareholders                             4.28       0.92       3.35       2.73      11.28
       Net Margin                                                     14%         4%        11%         9%        10%


       Balance Sheet Key Items
       Total Assets                                                240.75     228.54     229.59     234.37     234.37
       Cash & Short Term Investments                                36.80      27.25      24.12      31.24      31.24
       % of Assets                                                    15%        12%        11%        13%        13%
       Current Assets -Total                                        67.86      55.79      55.81      61.24      61.24
       % of Assets                                                    28%        24%        24%        26%        26%
       Total Liabilities                                            62.22      50.12      49.10      52.43      52.43
       % of Assets                                                    26%        22%        21%        22%        22%
       Current Liabilities - Total                                  29.38      17.46      14.95      18.16      18.16
       % of Assets                                                   12%          8%         7%         8%         8%
       Long Term Debt                                                  NA         NA         NA         NA         NA
       % of Assets                                                    NM          NM         NM         NM         NM
       Total Equity                                                178.53     178.42     180.49     181.94     181.94
       % of Assets                                                    74%        78%        79%        78%        78%


       Cash Flow Statement Key Items
       Net Cash Flow - Operating Activities                          2.76       4.84       1.20       7.88      16.68
       Net Cash Flow - Investing                                    (0.27)     (0.63)      (1.28)     (0.76)     (2.93)
       Net Cash Flow - Financing                                   (13.92)    (13.75)      (3.06)     0.00      (30.74)


      Source: Capital IQ

       PRICE / VOLUME


                                                                                     Source: Channelchek/QuoteMedia

            Noble Capital Markets' Nineteenth Annual Small & Microcap Investor Conference
   154   155   156   157   158   159   160   161   162   163   164