
Page 163 - NobleCon19revC2_Neat
P. 163
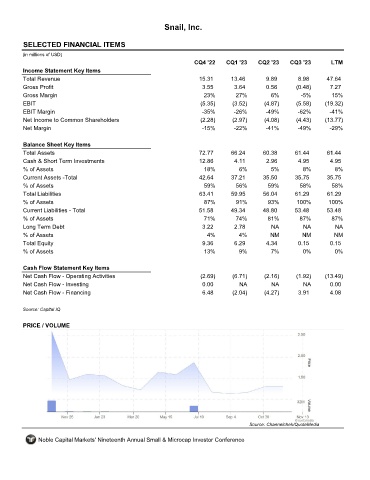
Snail, Inc.


       SELECTED FINANCIAL ITEMS                                SNAL

      (in millions of USD)
                                                                  CQ4 '22    CQ1 '23    CQ2 '23    CQ3 '23        LTM
       Income Statement Key Items
       Total Revenue                                                15.31      13.46       9.89       8.98      47.64
       Gross Profit                                                  3.55       3.64       0.56       (0.48)     7.27
       Gross Margin                                                  23%         27%         6%        -5%        15%
       EBIT                                                         (5.35)     (3.52)      (4.87)     (5.58)    (19.32)
       EBIT Margin                                                   -35%       -26%       -49%       -62%       -41%
       Net Income to Common Shareholders                            (2.28)     (2.97)      (4.08)     (4.43)    (13.77)
       Net Margin                                                    -15%       -22%       -41%       -49%       -29%


       Balance Sheet Key Items
       Total Assets                                                 72.77      66.24      60.38      61.44      61.44
       Cash & Short Term Investments                                12.86       4.11       2.96       4.95       4.95
       % of Assets                                                    18%         6%         5%         8%         8%
       Current Assets -Total                                        42.64      37.21      35.50      35.75      35.75
       % of Assets                                                    59%        56%        59%        58%        58%
       Total Liabilities                                            63.41      59.95      56.04      61.29      61.29
       % of Assets                                                    87%        91%        93%       100%       100%
       Current Liabilities - Total                                  51.58      49.34      48.80      53.48      53.48
       % of Assets                                                   71%         74%        81%        87%        87%
       Long Term Debt                                                3.22       2.78         NA         NA         NA
       % of Assets                                                     4%         4%         NM         NM         NM
       Total Equity                                                  9.36       6.29       4.34       0.15       0.15
       % of Assets                                                    13%         9%         7%         0%         0%


       Cash Flow Statement Key Items
       Net Cash Flow - Operating Activities                         (2.69)     (6.71)      (2.16)     (1.92)    (13.49)
       Net Cash Flow - Investing                                     0.00         NA         NA         NA       0.00
       Net Cash Flow - Financing                                     6.48      (2.04)      (4.27)     3.91       4.08


      Source: Capital IQ

       PRICE / VOLUME


                                                                                     Source: Channelchek/QuoteMedia

            Noble Capital Markets' Nineteenth Annual Small & Microcap Investor Conference