Page 167 - NobleCon19revC2_Neat
        P. 167
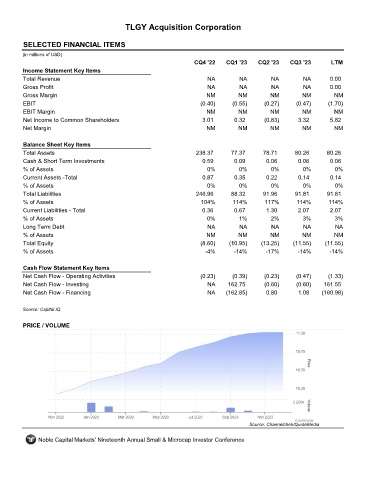
     TLGY Acquisition Corporation
       SELECTED FINANCIAL ITEMS                                TLGY
      (in millions of USD)
                                                                  CQ4 '22    CQ1 '23    CQ2 '23    CQ3 '23        LTM
       Income Statement Key Items
       Total Revenue                                                   NA         NA         NA         NA       0.00
       Gross Profit                                                    NA         NA         NA         NA       0.00
       Gross Margin                                                   NM          NM         NM         NM         NM
       EBIT                                                         (0.40)     (0.55)      (0.27)     (0.47)     (1.70)
       EBIT Margin                                                    NM          NM         NM         NM         NM
       Net Income to Common Shareholders                             3.01       0.32       (0.83)     3.32       5.82
       Net Margin                                                     NM          NM         NM         NM         NM
       Balance Sheet Key Items
       Total Assets                                                238.37      77.37      78.71      80.26      80.26
       Cash & Short Term Investments                                 0.59       0.09       0.06       0.06       0.06
       % of Assets                                                     0%         0%         0%         0%         0%
       Current Assets -Total                                         0.87       0.35       0.22       0.14       0.14
       % of Assets                                                     0%         0%         0%         0%         0%
       Total Liabilities                                           246.96      88.32      91.96      91.81      91.81
       % of Assets                                                  104%        114%       117%       114%       114%
       Current Liabilities - Total                                   0.36       0.67       1.30       2.07       2.07
       % of Assets                                                     0%         1%         2%         3%         3%
       Long Term Debt                                                  NA         NA         NA         NA         NA
       % of Assets                                                    NM          NM         NM         NM         NM
       Total Equity                                                 (8.60)    (10.95)    (13.25)     (11.55)    (11.55)
       % of Assets                                                    -4%       -14%       -17%       -14%       -14%
       Cash Flow Statement Key Items
       Net Cash Flow - Operating Activities                         (0.23)     (0.39)      (0.23)     (0.47)     (1.33)
       Net Cash Flow - Investing                                       NA     162.75       (0.60)     (0.60)   161.55
       Net Cash Flow - Financing                                       NA    (162.85)      0.80       1.08     (160.98)
      Source: Capital IQ
       PRICE / VOLUME
                                                                                     Source: Channelchek/QuoteMedia
            Noble Capital Markets' Nineteenth Annual Small & Microcap Investor Conference
     	
