Page 37 - NobleCon19revC2_Neat
P. 37

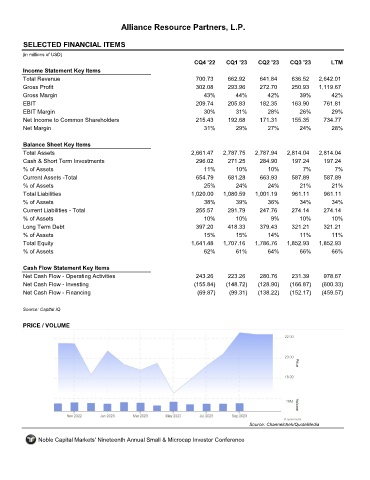
Alliance Resource Partners, L.P.


       SELECTED FINANCIAL ITEMS                                ARLP

      (in millions of USD)
                                                                  CQ4 '22    CQ1 '23    CQ2 '23    CQ3 '23        LTM
       Income Statement Key Items
       Total Revenue                                               700.73     662.92     641.84     636.52    2,642.01
       Gross Profit                                                302.08     293.96     272.70     250.93    1,119.67
       Gross Margin                                                  43%         44%        42%        39%        42%
       EBIT                                                        209.74     205.83     182.35     163.90     761.81
       EBIT Margin                                                    30%        31%        28%        26%        29%
       Net Income to Common Shareholders                           215.43     192.68     171.31     155.35     734.77
       Net Margin                                                     31%        29%        27%        24%        28%


       Balance Sheet Key Items
       Total Assets                                              2,661.47   2,787.75   2,787.94   2,814.04    2,814.04
       Cash & Short Term Investments                               296.02     271.25     284.90     197.24     197.24
       % of Assets                                                    11%        10%        10%         7%         7%
       Current Assets -Total                                       654.79     681.28     663.93     587.89     587.89
       % of Assets                                                    25%        24%        24%        21%        21%
       Total Liabilities                                         1,020.00   1,080.59   1,001.19     961.11     961.11
       % of Assets                                                    38%        39%        36%        34%        34%
       Current Liabilities - Total                                 255.57     291.79     247.76     274.14     274.14
       % of Assets                                                   10%         10%         9%        10%        10%
       Long Term Debt                                              397.20     418.33     379.43     321.21     321.21
       % of Assets                                                   15%         15%        14%        11%        11%
       Total Equity                                              1,641.48   1,707.16   1,786.76   1,852.93    1,852.93
       % of Assets                                                    62%        61%        64%        66%        66%


       Cash Flow Statement Key Items
       Net Cash Flow - Operating Activities                        243.26     223.26     280.76     231.39     978.67
       Net Cash Flow - Investing                                  (155.84)   (148.72)   (128.90)   (166.87)    (600.33)
       Net Cash Flow - Financing                                   (69.87)    (99.31)   (138.22)   (152.17)    (459.57)


      Source: Capital IQ

       PRICE / VOLUME


                                                                                     Source: Channelchek/QuoteMedia

            Noble Capital Markets' Nineteenth Annual Small & Microcap Investor Conference
   32   33   34   35   36   37   38   39   40   41   42