
Page 41 - NobleCon19revC2_Neat
P. 41
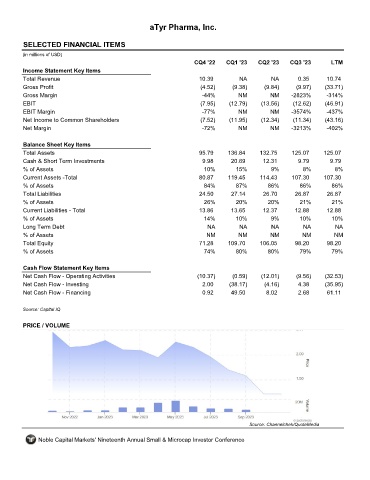
aTyr Pharma, Inc.


       SELECTED FINANCIAL ITEMS                                LIFE

      (in millions of USD)
                                                                  CQ4 '22    CQ1 '23    CQ2 '23    CQ3 '23        LTM
       Income Statement Key Items
       Total Revenue                                                10.39         NA         NA       0.35      10.74
       Gross Profit                                                 (4.52)     (9.38)      (9.84)     (9.97)    (33.71)
       Gross Margin                                                  -44%         NM         NM     -2823%      -314%
       EBIT                                                         (7.95)    (12.79)    (13.56)     (12.62)    (46.91)
       EBIT Margin                                                   -77%         NM         NM     -3574%      -437%
       Net Income to Common Shareholders                            (7.52)    (11.95)    (12.34)     (11.34)    (43.16)
       Net Margin                                                    -72%         NM         NM     -3213%      -402%


       Balance Sheet Key Items
       Total Assets                                                 95.79     136.84     132.75     125.07     125.07
       Cash & Short Term Investments                                 9.98      20.69      12.31       9.79       9.79
       % of Assets                                                    10%        15%         9%         8%         8%
       Current Assets -Total                                        80.87     119.45     114.43     107.30     107.30
       % of Assets                                                    84%        87%        86%        86%        86%
       Total Liabilities                                            24.50      27.14      26.70      26.87      26.87
       % of Assets                                                    26%        20%        20%        21%        21%
       Current Liabilities - Total                                  13.86      13.65      12.37      12.88      12.88
       % of Assets                                                   14%         10%         9%        10%        10%
       Long Term Debt                                                  NA         NA         NA         NA         NA
       % of Assets                                                    NM          NM         NM         NM         NM
       Total Equity                                                 71.28     109.70     106.05      98.20      98.20
       % of Assets                                                    74%        80%        80%        79%        79%


       Cash Flow Statement Key Items
       Net Cash Flow - Operating Activities                        (10.37)     (0.59)    (12.01)      (9.56)    (32.53)
       Net Cash Flow - Investing                                     2.00     (38.17)      (4.16)     4.38      (35.95)
       Net Cash Flow - Financing                                     0.92      49.50       8.02       2.68      61.11


      Source: Capital IQ

       PRICE / VOLUME


                                                                                     Source: Channelchek/QuoteMedia

            Noble Capital Markets' Nineteenth Annual Small & Microcap Investor Conference