Page 47 - NobleCon19revC2_Neat
P. 47

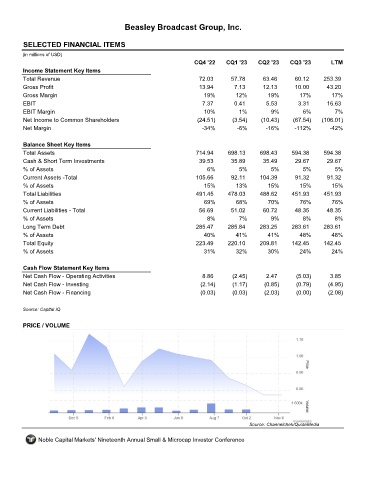
Beasley Broadcast Group, Inc.


       SELECTED FINANCIAL ITEMS                                BBGI

      (in millions of USD)
                                                                  CQ4 '22    CQ1 '23    CQ2 '23    CQ3 '23        LTM
       Income Statement Key Items
       Total Revenue                                                72.03      57.78      63.46      60.12     253.39
       Gross Profit                                                 13.94       7.13      12.13      10.00      43.20
       Gross Margin                                                  19%         12%        19%        17%        17%
       EBIT                                                          7.37       0.41       5.53       3.31      16.63
       EBIT Margin                                                    10%         1%         9%         6%         7%
       Net Income to Common Shareholders                           (24.51)     (3.54)    (10.43)     (67.54)   (106.01)
       Net Margin                                                    -34%        -6%       -16%      -112%       -42%


       Balance Sheet Key Items
       Total Assets                                                714.94     698.13     698.43     594.38     594.38
       Cash & Short Term Investments                                39.53      35.89      35.49      29.67      29.67
       % of Assets                                                     6%         5%         5%         5%         5%
       Current Assets -Total                                       105.66      92.11     104.39      91.32      91.32
       % of Assets                                                    15%        13%        15%        15%        15%
       Total Liabilities                                           491.45     478.03     488.62     451.93     451.93
       % of Assets                                                    69%        68%        70%        76%        76%
       Current Liabilities - Total                                  56.69      51.02      60.72      48.35      48.35
       % of Assets                                                     8%         7%         9%         8%         8%
       Long Term Debt                                              285.47     285.84     283.25     283.61     283.61
       % of Assets                                                   40%         41%        41%        48%        48%
       Total Equity                                                223.49     220.10     209.81     142.45     142.45
       % of Assets                                                    31%        32%        30%        24%        24%


       Cash Flow Statement Key Items
       Net Cash Flow - Operating Activities                          8.86      (2.45)      2.47       (5.03)     3.85
       Net Cash Flow - Investing                                    (2.14)     (1.17)      (0.85)     (0.79)     (4.95)
       Net Cash Flow - Financing                                    (0.03)     (0.03)      (2.03)     (0.00)     (2.08)


      Source: Capital IQ

       PRICE / VOLUME


                                                                                     Source: Channelchek/QuoteMedia

            Noble Capital Markets' Nineteenth Annual Small & Microcap Investor Conference
   42   43   44   45   46   47   48   49   50   51   52