
Page 51 - NobleCon19revC2_Neat
P. 51
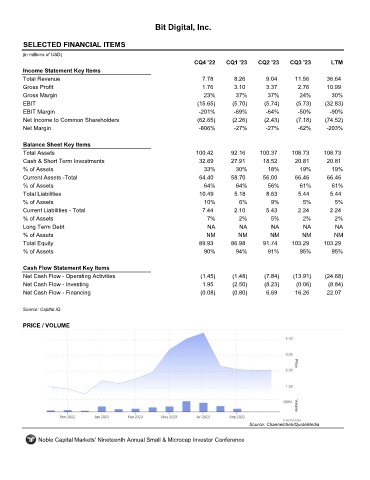
Bit Digital, Inc.


       SELECTED FINANCIAL ITEMS                                BTBT

      (in millions of USD)
                                                                  CQ4 '22    CQ1 '23    CQ2 '23    CQ3 '23        LTM
       Income Statement Key Items
       Total Revenue                                                 7.78       8.26       9.04      11.56      36.64
       Gross Profit                                                  1.76       3.10       3.37       2.76      10.99
       Gross Margin                                                  23%         37%        37%        24%        30%
       EBIT                                                        (15.65)     (5.70)      (5.74)     (5.73)    (32.83)
       EBIT Margin                                                  -201%       -69%       -64%       -50%       -90%
       Net Income to Common Shareholders                           (62.65)     (2.26)      (2.43)     (7.18)    (74.52)
       Net Margin                                                   -806%       -27%       -27%       -62%      -203%


       Balance Sheet Key Items
       Total Assets                                                100.42      92.16     100.37     108.73     108.73
       Cash & Short Term Investments                                32.69      27.91      18.52      20.81      20.81
       % of Assets                                                    33%        30%        18%        19%        19%
       Current Assets -Total                                        64.40      58.70      56.00      66.46      66.46
       % of Assets                                                    64%        64%        56%        61%        61%
       Total Liabilities                                            10.49       5.18       8.63       5.44       5.44
       % of Assets                                                    10%         6%         9%         5%         5%
       Current Liabilities - Total                                   7.44       2.10       5.43       2.24       2.24
       % of Assets                                                     7%         2%         5%         2%         2%
       Long Term Debt                                                  NA         NA         NA         NA         NA
       % of Assets                                                    NM          NM         NM         NM         NM
       Total Equity                                                 89.93      86.98      91.74     103.29     103.29
       % of Assets                                                    90%        94%        91%        95%        95%


       Cash Flow Statement Key Items
       Net Cash Flow - Operating Activities                         (1.45)     (1.48)      (7.84)    (13.91)    (24.68)
       Net Cash Flow - Investing                                     1.95      (2.50)      (8.23)     (0.06)     (8.84)
       Net Cash Flow - Financing                                    (0.08)     (0.80)      6.69      16.26      22.07


      Source: Capital IQ

       PRICE / VOLUME


                                                                                     Source: Channelchek/QuoteMedia

            Noble Capital Markets' Nineteenth Annual Small & Microcap Investor Conference