Page 53 - NobleCon19revC2_Neat
P. 53

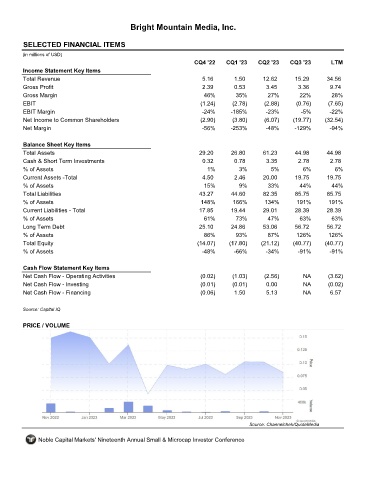
Bright Mountain Media, Inc.


       SELECTED FINANCIAL ITEMS                                BMTM

      (in millions of USD)
                                                                  CQ4 '22    CQ1 '23    CQ2 '23    CQ3 '23        LTM
       Income Statement Key Items
       Total Revenue                                                 5.16       1.50      12.62      15.29      34.56
       Gross Profit                                                  2.39       0.53       3.45       3.36       9.74
       Gross Margin                                                  46%         35%        27%        22%        28%
       EBIT                                                         (1.24)     (2.78)      (2.88)     (0.76)     (7.65)
       EBIT Margin                                                   -24%      -185%       -23%        -5%       -22%
       Net Income to Common Shareholders                            (2.90)     (3.80)      (6.07)    (19.77)    (32.54)
       Net Margin                                                    -56%      -253%       -48%      -129%       -94%


       Balance Sheet Key Items
       Total Assets                                                 29.20      26.80      61.23      44.98      44.98
       Cash & Short Term Investments                                 0.32       0.78       3.35       2.78       2.78
       % of Assets                                                     1%         3%         5%         6%         6%
       Current Assets -Total                                         4.50       2.46      20.00      19.75      19.75
       % of Assets                                                    15%         9%        33%        44%        44%
       Total Liabilities                                            43.27      44.60      82.35      85.75      85.75
       % of Assets                                                  148%        166%       134%       191%       191%
       Current Liabilities - Total                                  17.85      19.44      29.01      28.39      28.39
       % of Assets                                                   61%         73%        47%        63%        63%
       Long Term Debt                                               25.10      24.86      53.06      56.72      56.72
       % of Assets                                                   86%         93%        87%       126%       126%
       Total Equity                                                (14.07)    (17.80)    (21.12)     (40.77)    (40.77)
       % of Assets                                                   -48%       -66%       -34%       -91%       -91%


       Cash Flow Statement Key Items
       Net Cash Flow - Operating Activities                         (0.02)     (1.03)      (2.56)       NA       (3.62)
       Net Cash Flow - Investing                                    (0.01)     (0.01)      0.00         NA       (0.02)
       Net Cash Flow - Financing                                    (0.06)      1.50       5.13         NA       6.57


      Source: Capital IQ

       PRICE / VOLUME


                                                                                     Source: Channelchek/QuoteMedia

            Noble Capital Markets' Nineteenth Annual Small & Microcap Investor Conference
   48   49   50   51   52   53   54   55   56   57   58