Page 57 - NobleCon19revC2_Neat
P. 57

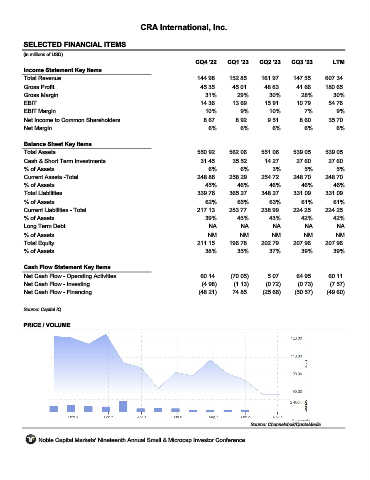
CRA International, Inc.


       SELECTED FINANCIAL ITEMS                                CRAI

      (in millions of USD)
                                                                  CQ4 '22    CQ1 '23    CQ2 '23    CQ3 '23        LTM
       Income Statement Key Items
       Total Revenue                                               144.98     152.85     161.97     147.55     607.34
       Gross Profit                                                 45.35      45.01      48.63      41.66     180.65
       Gross Margin                                                  31%         29%        30%        28%        30%
       EBIT                                                         14.36      13.69      15.91      10.79      54.76
       EBIT Margin                                                    10%         9%        10%         7%         9%
       Net Income to Common Shareholders                             8.67       8.92       9.51       8.60      35.70
       Net Margin                                                      6%         6%         6%         6%         6%


       Balance Sheet Key Items
       Total Assets                                                550.92     562.06     551.06     539.05     539.05
       Cash & Short Term Investments                                31.45      35.52      14.27      27.60      27.60
       % of Assets                                                     6%         6%         3%         5%         5%
       Current Assets -Total                                       248.86     258.29     254.72     248.70     248.70
       % of Assets                                                    45%        46%        46%        46%        46%
       Total Liabilities                                           339.76     365.27     348.27     331.09     331.09
       % of Assets                                                    62%        65%        63%        61%        61%
       Current Liabilities - Total                                 217.13     253.77     238.99     224.25     224.25
       % of Assets                                                   39%         45%        43%        42%        42%
       Long Term Debt                                                  NA         NA         NA         NA         NA
       % of Assets                                                    NM          NM         NM         NM         NM
       Total Equity                                                211.15     196.78     202.79     207.96     207.96
       % of Assets                                                    38%        35%        37%        39%        39%


       Cash Flow Statement Key Items
       Net Cash Flow - Operating Activities                         60.14     (70.05)      5.07      64.95      60.11
       Net Cash Flow - Investing                                    (4.98)     (1.13)      (0.72)     (0.73)     (7.57)
       Net Cash Flow - Financing                                   (48.21)     74.85     (25.66)     (50.57)    (49.60)


      Source: Capital IQ

       PRICE / VOLUME


                                                                                     Source: Channelchek/QuoteMedia

            Noble Capital Markets' Nineteenth Annual Small & Microcap Investor Conference
   52   53   54   55   56   57   58   59   60   61   62