Page 65 - NobleCon19revC2_Neat
P. 65

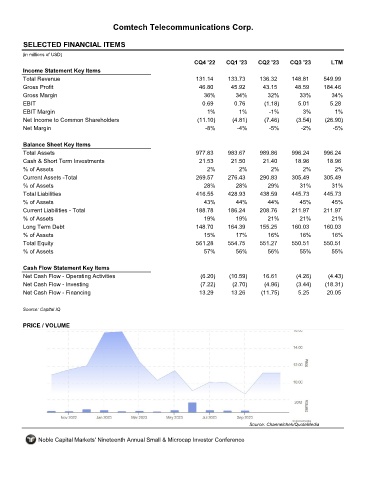
Comtech Telecommunications Corp.


       SELECTED FINANCIAL ITEMS                                CMTL

      (in millions of USD)
                                                                  CQ4 '22    CQ1 '23    CQ2 '23    CQ3 '23        LTM
       Income Statement Key Items
       Total Revenue                                               131.14     133.73     136.32     148.81     549.99
       Gross Profit                                                 46.80      45.92      43.15      48.59     184.46
       Gross Margin                                                  36%         34%        32%        33%        34%
       EBIT                                                          0.69       0.76       (1.18)     5.01       5.28
       EBIT Margin                                                     1%         1%        -1%         3%         1%
       Net Income to Common Shareholders                           (11.10)     (4.81)      (7.46)     (3.54)    (26.90)
       Net Margin                                                     -8%        -4%        -5%        -2%        -5%


       Balance Sheet Key Items
       Total Assets                                                977.83     983.67     989.86     996.24     996.24
       Cash & Short Term Investments                                21.53      21.50      21.40      18.96      18.96
       % of Assets                                                     2%         2%         2%         2%         2%
       Current Assets -Total                                       269.57     276.43     290.83     305.49     305.49
       % of Assets                                                    28%        28%        29%        31%        31%
       Total Liabilities                                           416.55     428.93     438.59     445.73     445.73
       % of Assets                                                    43%        44%        44%        45%        45%
       Current Liabilities - Total                                 188.78     186.24     208.76     211.97     211.97
       % of Assets                                                   19%         19%        21%        21%        21%
       Long Term Debt                                              148.70     164.39     155.25     160.03     160.03
       % of Assets                                                   15%         17%        16%        16%        16%
       Total Equity                                                561.28     554.75     551.27     550.51     550.51
       % of Assets                                                    57%        56%        56%        55%        55%


       Cash Flow Statement Key Items
       Net Cash Flow - Operating Activities                         (6.20)    (10.59)     16.61       (4.26)     (4.43)
       Net Cash Flow - Investing                                    (7.22)     (2.70)      (4.96)     (3.44)    (18.31)
       Net Cash Flow - Financing                                    13.29      13.26     (11.75)      5.25      20.05


      Source: Capital IQ

       PRICE / VOLUME


                                                                                     Source: Channelchek/QuoteMedia

            Noble Capital Markets' Nineteenth Annual Small & Microcap Investor Conference
   60   61   62   63   64   65   66   67   68   69   70