Page 69 - NobleCon19revC2_Neat
P. 69

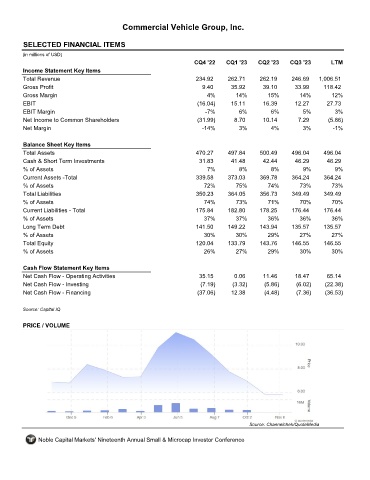
Commercial Vehicle Group, Inc.


       SELECTED FINANCIAL ITEMS                                CVGI

      (in millions of USD)
                                                                  CQ4 '22    CQ1 '23    CQ2 '23    CQ3 '23        LTM
       Income Statement Key Items
       Total Revenue                                               234.92     262.71     262.19     246.69    1,006.51
       Gross Profit                                                  9.40      35.92      39.10      33.99     118.42
       Gross Margin                                                    4%        14%        15%        14%        12%
       EBIT                                                        (16.04)     15.11      16.39      12.27      27.73
       EBIT Margin                                                    -7%         6%         6%         5%         3%
       Net Income to Common Shareholders                           (31.99)      8.70      10.14       7.29       (5.86)
       Net Margin                                                    -14%         3%         4%         3%        -1%


       Balance Sheet Key Items
       Total Assets                                                470.27     497.84     500.49     496.04     496.04
       Cash & Short Term Investments                                31.83      41.48      42.44      46.29      46.29
       % of Assets                                                     7%         8%         8%         9%         9%
       Current Assets -Total                                       339.58     373.03     369.78     364.24     364.24
       % of Assets                                                    72%        75%        74%        73%        73%
       Total Liabilities                                           350.23     364.05     356.73     349.49     349.49
       % of Assets                                                    74%        73%        71%        70%        70%
       Current Liabilities - Total                                 175.84     182.80     178.25     176.44     176.44
       % of Assets                                                   37%         37%        36%        36%        36%
       Long Term Debt                                              141.50     149.22     143.94     135.57     135.57
       % of Assets                                                   30%         30%        29%        27%        27%
       Total Equity                                                120.04     133.79     143.76     146.55     146.55
       % of Assets                                                    26%        27%        29%        30%        30%


       Cash Flow Statement Key Items
       Net Cash Flow - Operating Activities                         35.15       0.06      11.46      18.47      65.14
       Net Cash Flow - Investing                                    (7.19)     (3.32)      (5.86)     (6.02)    (22.38)
       Net Cash Flow - Financing                                   (37.06)     12.38       (4.48)     (7.36)    (36.53)


      Source: Capital IQ

       PRICE / VOLUME


                                                                                     Source: Channelchek/QuoteMedia

            Noble Capital Markets' Nineteenth Annual Small & Microcap Investor Conference
   64   65   66   67   68   69   70   71   72   73   74