Page 73 - NobleCon19revC2_Neat
P. 73

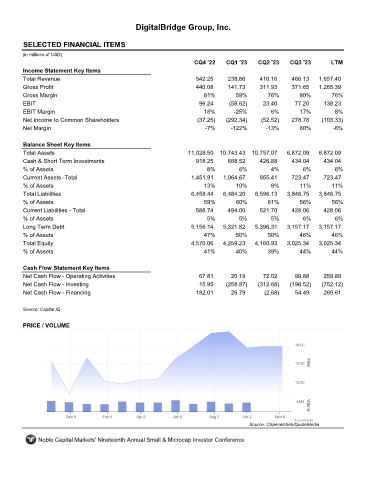
DigitalBridge Group, Inc.


       SELECTED FINANCIAL ITEMS                                DBRG

      (in millions of USD)
                                                                  CQ4 '22    CQ1 '23    CQ2 '23    CQ3 '23        LTM
       Income Statement Key Items
       Total Revenue                                               542.25     238.86     410.16     466.13    1,657.40
       Gross Profit                                                440.08     141.73     311.93     371.65    1,265.39
       Gross Margin                                                  81%         59%        76%        80%        76%
       EBIT                                                         96.24     (58.62)     23.40      77.20     138.23
       EBIT Margin                                                    18%       -25%         6%        17%         8%
       Net Income to Common Shareholders                           (37.25)   (292.34)    (52.52)    278.78     (103.33)
       Net Margin                                                     -7%      -122%       -13%        60%        -6%


       Balance Sheet Key Items
       Total Assets                                             11,028.50  10,743.43  10,757.07   6,872.09    6,872.09
       Cash & Short Term Investments                               918.25     668.52     426.88     434.04     434.04
       % of Assets                                                     8%         6%         4%         6%         6%
       Current Assets -Total                                     1,451.91   1,064.67     855.41     723.47     723.47
       % of Assets                                                    13%        10%         8%        11%        11%
       Total Liabilities                                         6,458.44   6,484.20   6,596.13   3,846.75    3,846.75
       % of Assets                                                    59%        60%        61%        56%        56%
       Current Liabilities - Total                                 588.74     494.00     521.70     428.06     428.06
       % of Assets                                                     5%         5%         5%         6%         6%
       Long Term Debt                                            5,156.14   5,321.82   5,396.31   3,157.17    3,157.17
       % of Assets                                                   47%         50%        50%        46%        46%
       Total Equity                                              4,570.06   4,259.23   4,160.93   3,025.34    3,025.34
       % of Assets                                                    41%        40%        39%        44%        44%


       Cash Flow Statement Key Items
       Net Cash Flow - Operating Activities                         67.81      20.19      72.02      99.88     259.89
       Net Cash Flow - Investing                                    15.95    (258.87)   (312.68)   (196.52)    (752.12)
       Net Cash Flow - Financing                                   182.01      26.79       (2.68)    54.49     260.61


      Source: Capital IQ

       PRICE / VOLUME


                                                                                     Source: Channelchek/QuoteMedia

            Noble Capital Markets' Nineteenth Annual Small & Microcap Investor Conference
   68   69   70   71   72   73   74   75   76   77   78