
Page 4 - E-Book-10-10-17
P. 4
Mean Reversion
Mean reversion is the theory which suggests that prices, returns, or various economic indicators tend to move to
the historical average or mean over time. This theory has led to many trading strategies which involve the
purchase or sale of a financial instrument whose recent performance has greatly differed from their historical
average without any apparent reason. For example, let the price of gold increase on average by INR 10 every day
and one day the price of gold increases by INR 40 without any significant news or factor behind this rise, then by
the mean reversion principle we can expect the price of gold to fall in the coming days such that the average
change in price of gold remains the same. In such a case, the mean reversionist would sell gold, speculating the
price to fall in the coming days. Thus, making profits by buying the same amount of gold he had sold earlier, now
at a lower price.
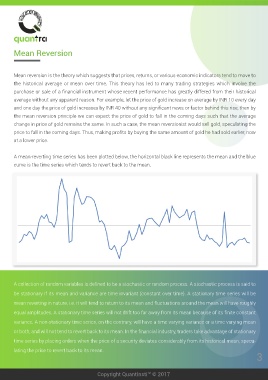
A mean-reverting time series has been plotted below, the horizontal black line represents the mean and the blue
curve is the time series which tends to revert back to the mean.
A collection of random variables is defined to be a stochastic or random process. A stochastic process is said to
be stationary if its mean and variance are time invariant (constant over time). A stationary time series will be
mean reverting in nature, i.e. it will tend to return to its mean and fluctuations around the mean will have roughly
equal amplitudes. A stationary time series will not drift too far away from its mean because of its finite constant
variance. A non-stationary time series, on the contrary, will have a time varying variance or a time varying mean
or both, and will not tend to revert back to its mean. In the financial industry, traders take advantage of stationary
time series by placing orders when the price of a security deviates considerably from its historical mean, specu-
lating the price to revert back to its mean.
3
Copyright QuantInsti™ © 2017