
Page 7 - E-Book-10-10-17
P. 7
Co-integration check – ADF Test
Consider the Python code
shown below for checking
co-integration:
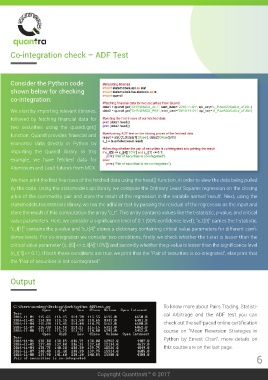
We start by importing relevant libraries,
followed by fetching financial data for
two securities using the quandl.get()
function. Quandl provides financial and
economic data directly in Python by
importing the Quandl library. In this
example, we have fetched data for
Aluminium and Lead futures from MCX.
We then print the first five rows of the fetched data using the head() function, in order to view the data being pulled
by the code. Using the statsmodels.api library, we compute the Ordinary Least Squares regression on the closing
price of the commodity pair and store the result of the regression in the variable named ‘result’. Next, using the
statsmodels.tsa.stattools library, we run the adfuller test by passing the residual of the regression as the input and
store the result of this computation the array “c_t”. This array contains values like the t-statistic, p-value, and critical
value parameters. Here, we consider a significance level of 0.1 (90% confidence level). “c_t[0]” carries the t-statistic,
“c_t[1]” contains the p-value and “c_t[4]” stores a dictionary containing critical value parameters for different confi-
dence levels. For co-integration we consider two conditions, firstly we check whether the t-stat is lesser than the
critical value parameter (c_t[0] <= c_t[4][‘10%’]) and secondly whether the p-value is lesser than the significance level
(c_t[1] <= 0.1). If both these conditions are true, we print that the “Pair of securities is co-integrated”, else print that
the “Pair of securities is not cointegrated”.
Output
To know more about Pairs Trading, Statisti-
cal Arbitrage and the ADF test you can
check out the self-paced online certification
course on “Mean Reversion Strategies in
Python by Ernest Chan“, more details on
this course are on the last page.
6
Copyright QuantInsti™ © 2017