Page 10 - 2017_HNO_IRQ_web_Neat
P. 10

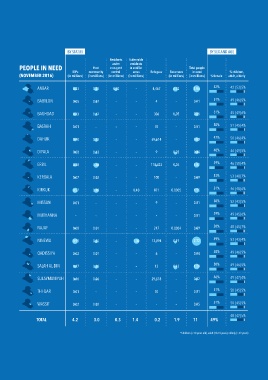
PART I: bREAkdOWN Of PEOPLE IN NEEd


                               BY STATUS                                                      BY SEX AND AGE
                                                  Residents  Vulnerable
                                                           residents
                                                   under
          PEOPLE IN NEED                  Host    non-govt  in conflict               Total people
                                 IDPs   community  control   areas  Refugees  Returnees  in need       % children,
          (NOVEMBER 2016)      (in millions)  (in millions)  (in millions)  (in millions)  (in millions)  (in millions)  % female  adult, elderly

                  ANBAR          0.43     0.41     0.30      –       4,467    0.72     1.86     52%    42 | 53| 5%

                  BABYLON        0.05     0.07      –        –        4        –       0.11     51%    49 | 46| 5%


                  BAGHDAD        0.43     0.17      –        –       306      0.05     0.65     51%    45 | 49| 6%

                  BASRAH         0.01      –        –        –        35       –       0.01     50%    51 | 45| 4%


                  DAHUK          0.40     0.33      –        –      69,614     –       0.80     47%    50 | 46| 4%


                  DIYALA         0.08     0.13      –        –        9       0.28     0.48     40%    46 | 49| 5%
                                                                                                39%
                  ERBIL          0.38     0.60      –        –      110,423   0.04     1.02            46 | 50| 4%

                                                                                                53%
                  KERBALA        0.07     0.02      –        –       100       –       0.09            53 | 40| 7%

  10              KIRKUK         0.57     0.48      –       0.10     871     0.0005    1.15     51%    46 | 48| 6%


                  MISSAN         0.01      –        –        –        9        –       0.01     50%    52 | 43| 5%

                  MUTHANNA        –        –        –        –        –        –       0.01     39%    49 | 45| 6%

                  NAJAF          0.08     0.01      –        –       247     0.0004    0.09     50%    48 | 45| 7%


                  NINEWA         0.98     0.25      –       1.30    12,994    0.19     2.72     49%    53 | 43| 4%


                  QADISSIYA      0.02     0.01      –        –        6        –       0.04     50%    49 | 46| 5%

                  SALAH AL-DIN   0.47     0.38      –        –        13      0.43     1.28     50%    49 | 46| 5%


                  SULAYMANIYAH   0.16     0.06      –        –      29,518     –       0.22     46%    49 | 47| 4%

                  THI-QAR        0.01      –        –        –        30       –       0.01     51%    50 | 45| 5%

                                                                                                51%
                  WASSIT         0.02     0.02      –        –        –        –       0.05            50 | 45| 5%

                                                                                                       48 | 47| 5%
                 TOTAL           4.2           3.0                 0.3             1.4                  0.2               1.9               11              49%


                                                                                 *Children (<18 years old), adult (18-59 years), elderly (>59 years)
   5   6   7   8   9   10   11   12   13   14   15