
Page 16 - Demo
P. 16
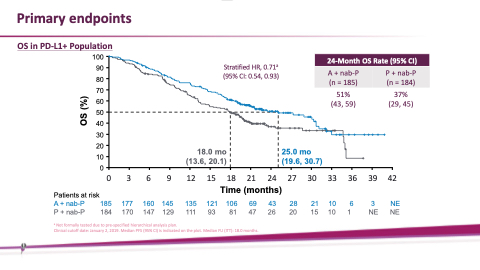
 Primary endpoints
OS in PD-L1+ Population
100 90 80 70 60 50 40 30 20 10 0
Patients at risk
A+nab-P 185 177
Stratified HR, 0.71a (95% CI: 0.54, 0.93)
24-Month OS Rate (95% CI)
            A + nab-P (n = 185)
51% (43, 59)
P + nab-P (n = 184)
37% (29, 45)
                                                   18.0 mo (13.6, 20.1)
25.0 mo (19.6, 30.7)
               0 3 6
9
12 15 18 21 24 27 30 33 36 39 42
Time (months)
135 121 106 69 43 28 21 10 6 3 NE
160 145
P+nab-P 184 170 147 129 111 93 81 47 26 20 15 10 1 NE NE
a Not formally tested due to pre-specified hierarchical analysis plan.
Clinical cutoff date: January 2, 2019. Median PFS (95% CI) is indicated on the plot. Median FU (ITT): 18.0 months.
   OS (%)
