
Page 18 - Demo
P. 18
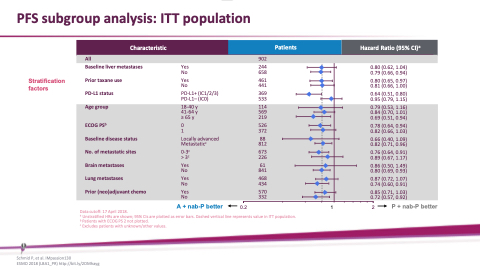
 PFS subgroup analysis: ITT population
Characteristic
Patients
Hazard Ratio (95% CI)a
 All 902
0.81 (0.70, 0.93)
          Stratification factors
Baseline liver metastases Prior taxane use
PD-L1 status
Yes 244 No 658
Yes 461 No 441
PD-L1+ (IC1/2/3) 369 PD-L1– (IC0) 533
0.80 (0.62, 1.04) 0.79 (0.66, 0.94)
0.80 (0.65, 0.97) 0.81 (0.66, 1.00)
0.64 (0.51, 0.80) 0.95 (0.79, 1.15)
           Age group
ECOG PSb
Baseline disease status No. of metastatic sites Brain metastases
Lung metastases
Prior (neo)adjuvant chemo
18-40 y 114 41-64 y 569 ≥ 65 y 219
0 526 1 372
Locally advanced 88 Metastaticc 812
0-3c 673 > 3c 226
Yes 61 No 841
Yes 468 No 434
Yes 570 No 332
0.79 (0.53, 1.16) 0.84 (0.70, 1.01) 0.69 (0.51, 0.94)
0.78 (0.64, 0.94) 0.82 (0.66, 1.03)
0.66 (0.40, 1.09) 0.82 (0.71, 0.96)
0.76 (0.64, 0.91) 0.89 (0.67, 1.17)
0.86 (0.50, 1.49) 0.80 (0.69, 0.93)
0.87 (0.72, 1.07) 0.74 (0.60, 0.91)
0.85 (0.71, 1.03) 0.72 (0.57, 0.92)
                                                         A + nab-P better 0.2 1
2 P + nab-P better
  Data cutoff: 17 April 2018.
a Unstratified HRs are shown; 95% CIs are plotted as error bars. Dashed vertical line represents value in ITT population. b Patients with ECOG PS 2 not plotted.
c Excludes patients with unknown/other values.
  Schmid P, et al. IMpassion130
ESMO 2018 (LBA1_PR) http://bit.ly/2DMhayg
