
Page 263 - Proceeding of Atrans Young Researcher's Forum 2019_Neat
P. 263
“Transportation for A Better Life:
Smart Mobility for Now and Then”
23 August 2019, Bangkok, Thailand
obstacles. As the cause of this, it is difficult to see
cracks and obstacles in the VR survey, and it is
thought that the result of the on-site survey has been
better because there are many places that were
overlooked. In addition, it is difficult to confirm
street signs and pedestrian signs in the VR survey,
and there are places that could not be found, so it is
considered that the score of the VR survey is
dropped.
4.3 Consistency between both surveys
Table 4 shows the total scores of the field
survey and the VR survey by the same person, the
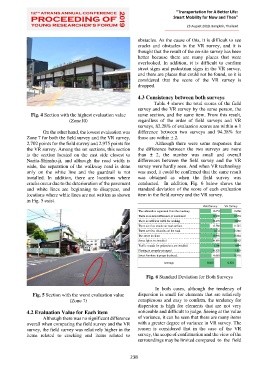
Fig. 4 Section with the highest evaluation value same section, and the same item. From this result,
(Zone10) regardless of the order of field surveys and VR
surveys, 82.28% of evaluation scores are within ± 1
On the other hand, the lowest evaluation was difference between two surveys and 94.38% for
Zone 7 for both the field survey and the VR survey, those are within ± 2.
2.702 points for the field survey and 2.975 points for Although there were some responses that
the VR survey. Among the set sections, this section the difference between the two surveys are more
is the section located on the east side closest to than ± 2, the number was small and overall
Narita-Shinsho-ji, and although the road width is differences between the field survey and the VR
wide, the separation of the walkway road is done survey were hardly seen. And when VR technology
only on the white line and the guardrail is not was used, it could be confirmed that the same result
installed. In addition, there are locations where was obtained as when the field survey was
cracks occur due to the deterioration of the pavement conducted. In addition, Fig. 6 below shows the
and white lines are beginning to disappear, and standard deviation of the score of each evaluation
locations where white lines are not written as shown item in the field survey and the VR survey.
in Fig. 5 exist.
Field Survey VR Survey
The sidewalk is separated from the roadway 0.653 0.666
There is no level difference or uneveness 0.990 0.974
There is sufficient width for walking 0.870 1.030
There are few cracks on road surface 0.580 0.725
There are few obstacles on the road 1.032 0.846
The street is clean 0.998 0.884
Street lights are installed 0.807 0.962
Traffic sounds for pedestrians are installed 1.166 1.094
Planting is properly arranged 0.820 1.118
Street furniture is properly placed. 0.683 0.916
Average 0.860 0.921
Fig. 6 Standard Deviation for Both Surveys
In both cases, although the tendency of
Fig. 5 Section with the worst evaluation value dispersion is small for elements that are relatively
(Zone 7) conspicuous and easy to confirm, the tendency for
dispersion is high for elements that are not very
4.2 Evaluation Value for Each item noticeable and difficult to judge. Seeing at the value
Although there was no significant difference of variance, it can be seen that there are many items
overall when comparing the field survey and the VR with a greater degree of variance in VR survey. The
survey, the field survey was relatively higher in the reason is considered that in the case of the VR
items related to cracking and items related to survey, the scope of confirmation and the view of the
surroundings may be limited compared to the field
238