
Page 264 - Proceeding of Atrans Young Researcher's Forum 2019_Neat
P. 264
“Transportation for A Better Life:
Smart Mobility for Now and Then”
23 August 2019, Bangkok, Thailand
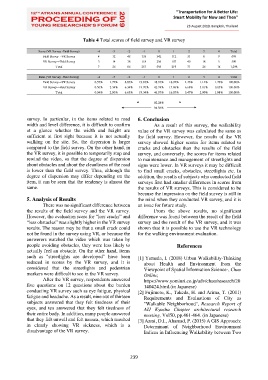
Table 4 Total scores of field survey and VR survey
Score (VR Survey -Field Survey) -4 -3 -2 -1 0 1 2 3 4 Total
Field Survey→VR Survey 4 12 48 133 342 112 31 8 9 699
VR Survey→Field Survey 3 14 38 118 256 107 40 18 5 599
Total 7 26 86 251 598 219 71 26 14 1,298
Ratio (VR Survey -Field Survey) -4 -3 -2 -1 0 1 2 3 4 Total
Field Survey→VR Survey 0.57% 1.72% 6.87% 19.03% 48.93% 16.02% 4.43% 1.14% 1.29% 100.00%
VR Survey→Field Survey 0.50% 2.34% 6.34% 19.70% 42.74% 17.86% 6.68% 3.01% 0.83% 100.00%
Total 0.54% 2.00% 6.63% 19.34% 46.07% 16.87% 5.47% 2.00% 1.08% 100.00%
82.28%
94.38%
survey. In particular, in the items related to road 6. Conclusion
width and level difference, it is difficult to confirm As a result of this survey, the walkability
at a glance whether the width and height are value of the VR survey was calculated the same as
sufficient at first sight because it is not actually the field survey. However, the results of the VR
walking on the site. So, the dispersion is larger survey showed higher scores for items related to
compared to the field survey. On the other hand, in cracks and obstacles than the results of the field
the VR survey, it is possible to temporarily stop and survey, and conversely, the scores for items related
rewind the video, so that the degree of dispersion to maintenance and management of streetlights and
about obstacles and about the cleanliness of the road signs were lower. In VR surveys it may be difficult
is lower than the field survey. Thus, although the to find small cracks, obstacles, streetlights etc. In
degree of dispersion may differ depending on the addition, the results of subjects who conducted field
item, it can be seen that the tendency is almost the surveys first had smaller differences in scores from
same. the results of VR surveys. This is considered to be
because the impression on the field survey is still in
5. Analysis of Results the mind when they conducted VR survey, and it is
There was no significant difference between an issue for future study.
the results of the field survey and the VR survey. From the above results, no significant
However, the evaluation score for “less cracks” and difference was found between the result of the field
“less obstacles” was slightly higher in the VR survey survey and the result of the VR survey, and it was
results. The reason may be that a small crack could shown that it is possible to use the VR technology
not be found in the survey using VR, or because the for the walking environment evaluation.
answerers watched the video which was taken by
people avoiding obstacles, they were less likely to References
actually feel an obstacle. On the other hand, items
such as "streetlights are developed" have been [1] Yamada, I. (2018) Urban Walkability-Thinking
reduced in scores by the VR survey, and it is about Health and Environment from the
considered that the streetlights and pedestrian Viewpoint of Spatial Information Science-, Chuo
markers were difficult to see in the VR survey. Online,
After the VR survey, respondents answered https://www.yomiuri.co.jp/adv/chuo/research/20
five questions on 12 questions about the burden 140424.html.(in Japanese)
conducting VR survey such as eye fatigue, physical [2] Fujimoto, K., Takeda, H. and Arima, T. (2011)
fatigue and headache. As a result, nine out of thirteen Requirements and Evaluations of City as
subjects answered that they felt tiredness of their "Walkable Neighborhood", Research Report of
eyes, and ten answered that they felt tiredness of AIJ Kyushu Chapter architectural research
their entire body. In addition, many people answered meeting, Vol50, pp.461-464. (in Japanese)
that they felt unwell and felt nausea, which resulted [3] Azmi, D.I., Ahamad, P. (2015) A GIS Approach:
in clearly showing VR sickness, which is a Determinant of Neighborhood Environment
disadvantage of the VR survey. Indices in Influencing Walkability between Two
239