
Page 22 - Demo
P. 22
Pygal lets you customize many elements of a plot. There are some excellent default themes, and many options for styling individual plot elements.
Using built-in styles
To use built-in styles, import the style and make an instance of the style class. Then pass the style object with the style argument when you make the chart object.
import pygal
from pygal.style import LightGreenStyle
x_values = list(range(11))
squares = [x**2 for x in x_values]
cubes = [x**3 for x in x_values]
chart_style = LightGreenStyle()
chart = pygal.Line(style=chart_style)
chart.force_uri_protocol = 'http'
chart.title = "Squares and Cubes"
chart.x_labels = x_values
chart.add('Squares', squares)
chart.add('Cubes', cubes)
chart.render_to_file('squares_cubes.svg')
Parametric built-in styles
Some built-in styles accept a custom color, then generate a theme based on that color.
from pygal.style import LightenStyle
--snip--
chart_style = LightenStyle('#336688') chart = pygal.Line(style=chart_style) --snip--
Customizing individual style properties
Style objects have a number of properties you can set individually.
chart_style = LightenStyle('#336688') chart_style.plot_background = '#CCCCCC' chart_style.major_label_font_size = 20 chart_style.label_font_size = 16 --snip--
Custom style class
You can start with a bare style class, and then set only the properties you care about.
chart_style = Style()
chart_style.colors = [
'#CCCCCC', '#AAAAAA', '#888888']
chart_style.plot_background = '#EEEEEE'
chart = pygal.Line(style=chart_style)
--snip--
Configuration settings
Some settings are controlled by a Config object.
my_config = pygal.Config()
my_config.show_y_guides = False
my_config.width = 1000
my_config.dots_size = 5
chart = pygal.Line(config=my_config)
--snip--
Styling series
You can give each series on a chart different style settings.
chart.add('Squares', squares, dots_size=2)
chart.add('Cubes', cubes, dots_size=3)
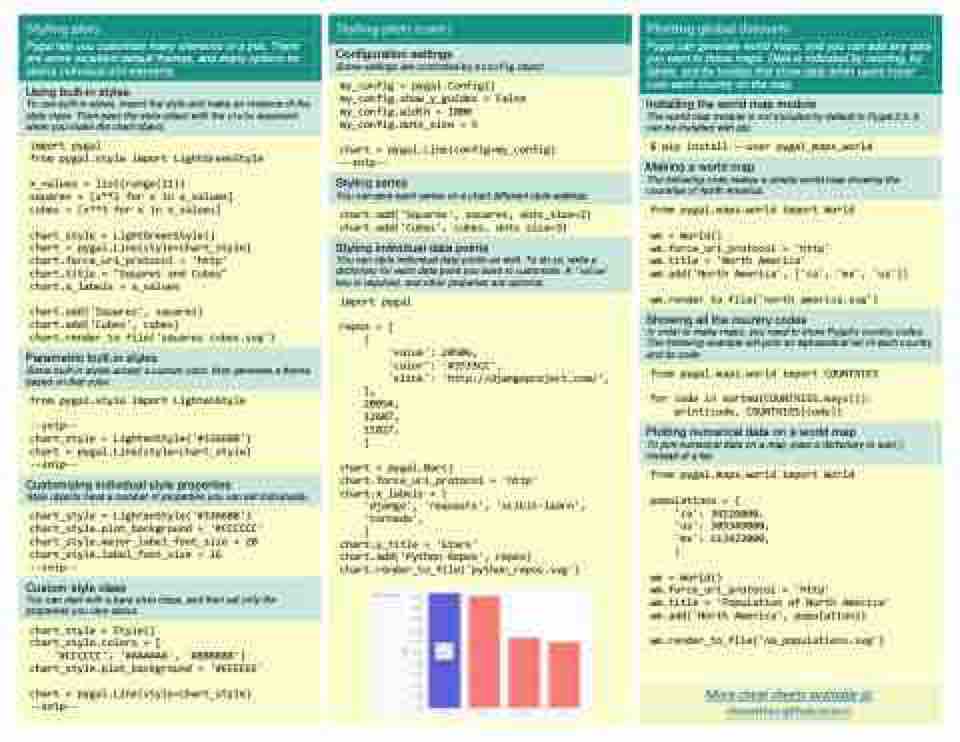
Styling individual data points
You can style individual data points as well. To do so, write a dictionary for each data point you want to customize. A 'value' key is required, and other properies are optional.
import pygal
repos = [ {
'value': 20506,
'color': '#3333CC',
'xlink': 'http://djangoproject.com/',
},
20054,
12607,
11827,
]
chart = pygal.Bar()
chart.force_uri_protocol = 'http'
chart.x_labels = [
'django', 'requests', 'scikit-learn',
'tornado',
]
chart.y_title = 'Stars'
chart.add('Python Repos', repos)
chart.render_to_file('python_repos.svg')
Pygal can generate world maps, and you can add any data you want to these maps. Data is indicated by coloring, by labels, and by tooltips that show data when users hover over each country on the map.
Installing the world map module
The world map module is not included by default in Pygal 2.0. It can be installed with pip:
$ pip install --user pygal_maps_world
Making a world map
The following code makes a simple world map showing the countries of North America.
from pygal.maps.world import World
wm = World()
wm.force_uri_protocol = 'http'
wm.title = 'North America'
wm.add('North America', ['ca', 'mx', 'us'])
wm.render_to_file('north_america.svg')
Showing all the country codes
In order to make maps, you need to know Pygal’s country codes. The following example will print an alphabetical list of each country and its code.
from pygal.maps.world import COUNTRIES
for code in sorted(COUNTRIES.keys()):
print(code, COUNTRIES[code])
Plotting numerical data on a world map
To plot numerical data on a map, pass a dictionary to add() instead of a list.
from pygal.maps.world import World
populations = {
'ca': 34126000,
'us': 309349000,
'mx': 113423000,
}
wm = World()
wm.force_uri_protocol = 'http'
wm.title = 'Population of North America'
wm.add('North America', populations)
wm.render_to_file('na_populations.svg')
More cheat sheets available at
