
Page 20 - 2017-2018 NSE FACTBOOK.cdr
P. 20
2017/2018 NSE FACT BOOK 2017/2018 NSE FACT BOOK
The Performance Documentary of Listed Nigerian Companies The Performance Documentary of Listed Nigerian Companies
5. Outlook for 2018 2017 2016 % Change
1
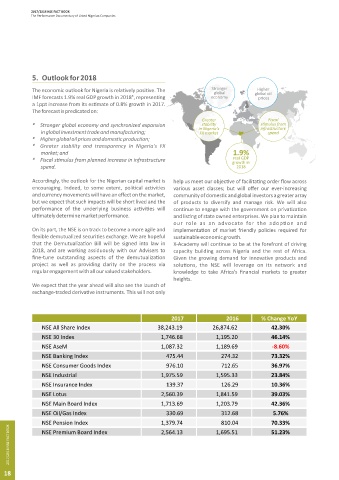
The economic outlook for Nigeria is rela vely posi ve. The Stronger Higher Total Market Capitaliza on (N) 22,917,906,741,966 16,185,729,639,210 41.59%
global global oil
IMF forecasts 1.9% real GDP growth in 2018⁵, represen ng economy prices ($) 63,662,620,467 51,329,494,939 24.03%
a 1ppt increase from its es mate of 0.8% growth in 2017. 2
Equi es Market Capitaliza on (N) 13,619,906,406,052 9,255,879,973,012 47.15%
The forecast is predicated on:
($) 37,834,124,298 29,352,995,189 28.89%
Greater Fiscal
stability
* Stronger global economy and synchronized expansion in Nigeria's s mulus from Bonds Market Capitaliza on (N) 9,291,305,749,890 6,925,051,015,073 34.17%
infrastructure
in global investment trade and manufacturing; FX market spend ($) 25,809,899,580 21,961,281,880 17.52%
* Higher global oil prices and domes c produc on;
ETF Market Capitaliza on (N) 6,694,586,025 4,798,651,125 39.51%
* Greater stability and transparency in Nigeria's FX
market; and 1.9% ($) 18,596,589 15,217,871 22.20%
real GDP
* Fiscal s mulus from planned increase in infrastructure growth in Total Volume – Equi es 100,459,841,811 95,814,790,203 4.85%
spend. 2018 Total Value (Turnover) - Equi es (N) 1,271,465,103,822 575,706,703,388 120.85%
($) 3,531,945,620 1,825,727,661 93.45%
Accordingly, the outlook for the Nigerian capital market is help us meet our objec ve of facilita ng order flow across
encouraging. Indeed, to some extent, poli cal ac vi es various asset classes; but will offer our ever-increasing Avg. Daily Volume - Equi es 406,720,007 387,914,130 4.85%
3
and currency movements will have an effect on the market, community of domes c and global investors a greater array Avg. Daily Value (Turnover) - Equi es 5,147,631,999 2,330,796,370 120.85%
but we expect that such impacts will be short lived and the of products to diversify and manage risk. We will also (N)
performance of the underlying business ac vi es will con nue to engage with the government on priva za on ($) 14,299,375 7,391,610 93.45%
4
ul mately determine market performance. and lis ng of state owned enterprises. We plan to maintain Turnover Velocity - Equi es (%) 9.34% 6.22%
our role as an advocate for the adop on and Value of Issues - Equi es New (N) 55,456,285,725 756,484,319 7,230.79%
5
On its part, the NSE is on track to become a more agile and implementa on of market friendly policies required for ($) 154,049,517 2,399,024 6,321.34%
flexible demutualized securi es exchange. We are hopeful sustainable economic growth. No of New Equity Issues 3 1
that the Demutualiza on Bill will be signed into law in X-Academy will con nue to be at the forefront of driving Value of Issues - Equi es Sup (N) 352,754,301,330 39,014,927,476 804.15%
6
2018, and are working assiduously with our Advisers to capacity building across Nigeria and the rest of Africa. ($) 979,900,279 123,727,294 691.98%
fine-tune outstanding aspects of the demutualiza on Given the growing demand for innova ve products and
project as well as providing clarity on the process via solu ons, the NSE will leverage on its network and No of Supplementary Equity Issues 16 5
regular engagement with all our valued stakeholders. knowledge to take Africa's financial markets to greater No. of Listed Companies 167 170
heights. No. of Listed Equi es 172 175
We expect that the year ahead will also see the launch of No. of Listed Bonds 80 64
exchange-traded deriva ve instruments. This will not only
No. of Listed ETPs 9 8
No. of Listed Securi es 261 247
No. of Trading Days 247 247
2017 2016 % Change YoY 7
Exchange Rate (Naira:USD) 359.99 315.33
NSE All Share Index 38,243.19 26,874.62 42.30%
NSE 30 Index 1,746.68 1,195.20 46.14%
NSE AseM 1,087.32 1,189.69 -8.60% 1 Figure includes equi es, ETFs and bonds.
2 Figure includes shares listed on Premium Board and ASeM.
NSE Banking Index 475.44 274.32 73.32% 3 Total value of share trading divided by the number of trading days.
4 Turnover Velocity – Equi es Turnover divided by Equi es Market Capitaliza on.
NSE Consumer Goods Index 976.10 712.65 36.97% 5
Figure include lis ng by introduc on.
NSE Industrial 1,975.59 1,595.33 23.84% 6 Figure includes rights issue, placement, employee share plan,lis ng of underwri ng commitment shares, merger and acquisi on,takeover
bid,conversion of preference shares to ordinary shares and block divestments.
NSE Insurance Index 139.37 126.29 10.36% 7 Source: Bloomberg
NSE Lotus 2,560.39 1,841.59 39.03%
NSE Main Board Index 1,713.69 1,203.79 42.36%
References
NSE Oil/Gas Index 330.69 312.68 5.76%
1
Source: CNN
NSE Pension Index 1,379.74 1,695.51 70.33%
810.04
2
2017/2018 NSE FACTBOOK 4 www.vanguardngr.com/2017/02/nigerias-1b-eurobond-oversubscribed-adeosun/ 2017/2018 NSE FACTBOOK
Source: Na onal Bureau of Sta s cs (NBS)
2,564.13
NSE Premium Board Index
51.23%
3
Source: Central Bank of Nigeria (CBN), AbokiFX.com “
Nigeria’s $1b Eurobond oversubscribed – Adeosun” February 10, 2017. Accessed at:
5
IMF World Economic Outlook October 2017
18 19