
Page 392 - CvSU T3 Campuses Annual Report
P. 392
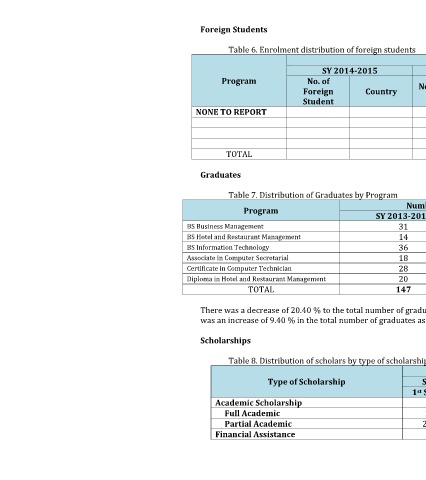
Foreign Students

                                                     Table 6. Enrolment distribution of foreign students
                                                                                                      Number of Students
                                                                          SY 2014-2015                 SY 2015-2016                   SY 2016-2017
                                                   Program            No. of                   No. of Foreign                    No. of
                                                                     Foreign       Country                       Country        Foreign         Country
                                                                                                  Student
                                                                     Student                                                    Student
                                             NONE TO REPORT


                                                    TOTAL

                                              Graduates

                                                     Table 7. Distribution of Graduates by Program
                                                                                             Number of Graduates (please include midyear graduates)
                                                        Program
                                                                                      SY 2013-2014                SY 2014-2015              SY 2015-2016
                                           BS Business Management                          31                           35                       29
                                           BS Hotel and Restaurant Management              14                           4                        17
                                           BS Information Technology                       36                           21                       22
                                           Associate in Computer Secretarial               18                           16                       18
                                           Certificate in Computer Technician              28                           22                       23
                                           Diploma in Hotel and Restaurant Management      20                           19                       19
                                                         TOTAL                            147                          117                       128

                                              There was a decrease of 20.40 % to the total number of graduates from SY 2013-2014 and SY 2014-2015. For SY 2015-2016, there
                                              was an increase of 9.40 % in the total number of graduates as compared from previous school year.

                                              Scholarships

                                                     Table 8. Distribution of scholars by type of scholarship
                                                                                                                  No. of Scholarship
                                                             Type of Scholarship                SY 2014-2015          SY 2015-2016        SY 2016-2017
                                                                                              1  Sem.   2  Sem.    1  Sem.    2  Sem.       1  Sem.
                                                                                               st
                                                                                                                                              st
                                                                                                          nd
                                                                                                                    st
                                                                                                                               nd
                                                  Academic Scholarship
                                                       Full Academic                             1         1          4          12            11
                                                       Partial Academic                         28         38        27          64            39
                                                  Financial Assistance