
Page 107 - GFS2019 Semster I
P. 107
1
0.0
0.0
0.0
0.0
Consolidated Nonfinancial
NFPS Public Sector (12) Non cash 43,605,525,535,332.3 39,658,998,523,304.0 26,407,166,064,326.0 28,638,543,383,869.4 4,883,427,569,828.0 -7,114,804,889,371.4 287,024,913,006.0 12,964,807,545,972.0 12,963,636,983,433.0 1,170,562,539.0 4,318,203,839,846.3 2,709,955,559,885.3 18,843,850,000.0 17,160,290,682.0 818,949,749,578.0 753,294,389,701.0 4,318,203,839,846.3 2,709,955,559,885.3 18,843,850,000.0 17,160,290,682.0 818,949,749,578.0 753,
... ... ... ... ... ... ... ... ... ... ... ... ...
Consoli dation Colum n (11) Non cashNon cash ... ... ... ... ... ... ... ... ... ... ... ... ... ... ... ... ... ... ... ... ... ... ... ... ... ... ... ... ... ... ... ... ... ... ... ... ... ... ...
Nonfinan cial public corporati ons (10) ... ... ... ... ... ... ... ... ... ... ... ... ... ... ... ... ... ... ... ... ... ... ... ... ... ... ... ... ... ... ... ... ... ... ... ... ... ... ...
b/ 4,883,427,569,828.0 287,024,913,006.0 1,170,562,539.0 4,318,203,839,846.3 2,709,955,559,885.3 18,843,850,000.0 17,160,290,682.0 818,949,749,578.0 753,294,389,701.0 4,318,203,839,846.3 2,709,955,559,885.3 18,843,850,000.0 17,160,290,682.0 818,949,749,578.0 753,294,389,701.0 0.0 0.0 0.0 0.0
General Government (9) Cash 43,605,525,535,332.3 39,658,998,523,304.0 26,407,166,064,326.0 28,638,543,383,869.4 -7,114,804,889,371.4 12,964,807,545,972.0 12,963,636,983,433.0
... ... ... ... ... ... ... ... ... ... ... ... ...
Consolidati on Column (8) Cash ... ... ... ... ... ... ... ... ... ... ... ... ... ... ... ... ... ... ... ... ... ... ... ... ... ... ... ... ... ... ... ... ... ... ... ... ... ... ...
Local Governments (7) Cash 16,098,609,371,094.5 13,499,614,221,749.8 11,524,015,070,904.8 15,954,037,097,220.8 2,729,177,422,548.0 -7,159,199,448,864.0 81,906,409,782.0 1,893,692,741,063.0 1,893,692,741,063.0 2,665,462,903,348.7 1,850,586,450,159.7 2,843,850,000.0 17,160,290,682.0 414,324,392,840.0 380,547,919,667.0 2,665,462,903,348.7 1,850,586,450,159.7 2,843,850,000.0 17,160,290,682.0 414,324,392,840.0 380,547,919,667.0
... ... ... ... ... 0.0 0.0 ... ... 0.0 0.0 ... ... ... ... ... ... ... ... ... ... ... 7/29/2019 3:01 PM
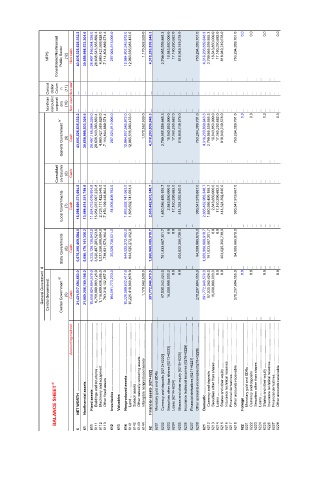
Fixed assets .....................................................................................................................................................................
Inventories ......................................................................................................................................................................
NET WORTH ......................................................................................................................................................................
State Governments (6) Cash 6,075,398,469,584.8 5,090,178,141,356.2 4,225,126,138,843.2 3,926,497,203,523.6 1,037,550,508,684.0 -738,921,573,364.4 20,526,730,021.0 844,525,272, 844,525,272,492.0 1,260,968,089,918.7 761,833,867,301.7 404,625,356,738.0 94,508,865,879.0 1,260,968,089,918. 761,833,867,301.7 404,625,356,738.0 94,508,865,879.0
0 ... ... ... ... ... 0.0 0.0 ... ... 0.0 0.0 ... ... 0.0 ... ... 0.0 ... ... 0.0 ... ... 0.0
General Government Central Government a/ Central Government (5) Cash 21,431,517,694,653.0 Nonfinancial assets ................................................................................................................................................................................................................................... 21,069,206,160,198.0 10,658,024,854,578.0 8,758,009,083,125.0 1,116,699,638,596.0 783,316,132,857.0 184,591,773,203.0
... Valuables ...................................................................................................................................................................... Nonproduced assets ...........................................................................................................................................492.0 Land .........................................................................................
Accounting method: Buildings and structures ......................................................................................... Machinery and equipment ......................................................................................... Other fixed assets ................................................................................................. Currency and deposits [6212+6222] .......................................................
BALANCE SHEET a/
6 61 611 6111 6112 6113 612 613 614 6141 6142 6143 6144 62 6201 6202 6203 6204 6205 6206 6207 6208 621 6212 6213 6214 6215 6216 6217 6218 622 6221 6222 6223 6224 6225 6226 6227 6228