
Page 108 - GFS2019 Semster I
P. 108
2
0.0
0.0
0.0
0.0
0.0
0.0
0.0
0.0
0.0
0.0
Consolidated Nonfinancial
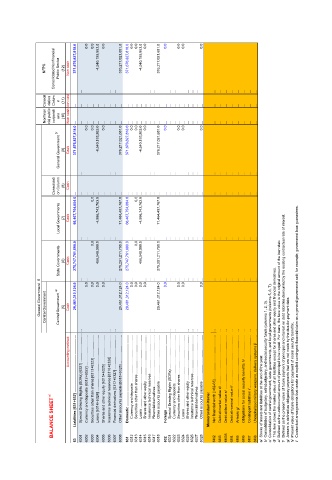
NFPS Public Sector (12) Non cash 371,676,827,818.0 -4,540,193,863.0 376,217,021,681.0 371,676,827,818.0 -4,540,193,863.0 376,217,021,681.0
... ... ... ... ... ... ... ... ... ... ... ... ... ... ... ... ... ...
Consoli dation Colum n (11) Non cashNon cash ... ... ... ... ... ... ... ... ... ... ... ... ... ... ... ... ... ... ... ... ... ... ... ... ... ... ... ... ... ... ... ... ... ...
Nonfinan cial public corporati ons (10) ... ... ... ... ... ... ... ... ... ... ... ... ... ... ... ... ... ... ... ... ... ... ... ... ... ... ... ... ... ... ... ... ... ...
b/ 371,676,827,818.0 0.0 0.0 -4,540,193,863.0 0.0 376,217,021,681.0 371,676,827,818.0 0.0 0.0 -4,540,193,863.0 0.0 376,217,021,681.0 0.0 0.0 0.0 0.0
General Government (9) Cash
... ... ... ... ... ... ... ... ... ... ... ... ... ... ... ... ... ...
Consolidati on Column (8) Cash ... ... ... ... 0.0 ... ... ... ... ... ... ... ... 0.0 ... ... ... ... ... ... ... ... ... ... ... ... ... ... ... ... ... ... ... ... ... ...
Local Governments (7) Cash 66,467,754,004.0 -4,996,743,763.0 71,464,497,767.0 66,467,754,004.0 -4,996,743,763.0 71,464,497,767.0
... ... 0.0 ... ... ... ... 0.0 ... ... ... ... ... ... ... ... ... ... ... ... ... ... ... ... ... ... 7/29/2019 3:01 PM
State Governments (6) Cash 275,747,761,690.0 456,549,900.0 275,291,211,790.0 275,747,761,690. 456,549,900.0 275,291,211,790.0
0 Liabilities [631+632] ......................................................................................................................................................................................................................................................................................... ... ... 0.0 0.0 0.0 ... 0.0 ... ... ... 0.0 0.0 0.0 ... 0.0 ... ... 0.0 ... ... 0.0 ... 0.0 ... ... ... 0.0 ... ... ...
General Government Central Government a/ Central Government (5) Cash 29,461,312,124.0 29,461,312,124.0 29,461,312,124.0 29,461,312,124.0 Contingent liabilities i/ ................................................................................................................................................................................................................
... Loans [6314+6324] .......................................................................................................................................... ... ... Domestic .....................................................................................................................................................................0 Shares and other equity ................................................................................
Accounting method: Special Drawing Rights (SDRs) [6321] ......................................................................................... Currency and deposits [6312+6322] ......................................................................................... Securities other than shares [6313+6323] ............................................................................................. Shares and other equity [6315+6325] .................
BALANCE SHEET a/ Memorandum items: a/ Stocks of assets and liabilities at the end of the year.
63 6301 6302 6303 6304 6305 6306 6307 6308 631 6312 6313 6314 6315 6316 6317 6318 632 6321 6322 6323 6324 6325 6326 6327 6328 6M2 6M3 6M35 6M4 6M5 6M6 6M7 6M8