Page 31 - 2016 CZS Impact Report
P. 31

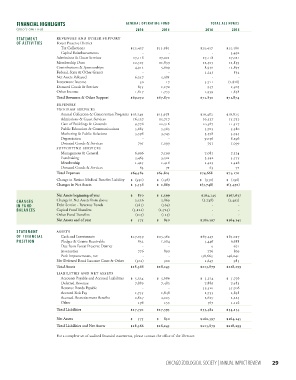
FINANCIAL HIGHLIGHTS                         GENERAL OPERATING FUND             TOTAL ALL FUNDS
        (OOO’S OMITTED)                                  2016       2015              2016       2015
        STATEMENT       REVENUES AND OTHER SUPPORT
        OF ACTIVITIES   Forest Preserve District
                          Tax Collections              $ 15,437   $15,380           $15,437    $15,380
                          Capital Reimbursements            -          -                 -      3,492
                        Admissions & Guest Services     27,118     27,021            27,118     27,021
                        Membership Dues                 12,505     11,839            12,505     11,839
                        Contributions & Sponsorships     4,912      5,609             8,950     12,895
                        Federal, State & Other Grants       -          -              1,243       834
                        Net Assets Released              6,357      5,081                -          -
                        Investment Income                  50         17              3,711    (2,828)
                        Donated Goods & Services          854       1,170              947      1,403
                        Other Income                     1,817      1,753             1,939     1,838
                        Total Revenues & Other Support    ,    ,         ,   ,
                        EXPENSES
                        PROGRAM SERVICES
                          Animal Collection & Conservation Programs  $16,249    $15,978    $16,483    $16,815
                          Admissions & Guest Services   16,537     15,717            16,537     15,732
                          Care of Buildings & Grounds    9,778     10,516            10,387     11,517
                          Public Education & Communications  5,684   5,563            5,705     5,580
                          Marketing & Public Relations   3,598      3,745             3,598     3,745
                          Depreciation                      -          -              9,056     8,296
                          Donated Goods & Services        791       1,099              791      1,099
                        SUPPORTING SERVICES
                          Management & General           6,996      7,199             7,081     7,324
                          Fundraising                    3,463      3,501             3,542     3,575
                          Membership                     1,425      1,416             1,425     1,416
                         Donated Goods & Services          63         71                63        71
                        Total Expenses                  ,   ,           ,    ,
                        Change in Retiree Medical Benefi ts Liability   $  (930)  $ (196)  $ (930)  $ (196)
                        Changes in Net Assets            ,    ,           (,)   (,)

                        Net Assets beginning of year           ,           ,   ,
        CHANGES         Change in Net Assets from above     3,536   2,869               (3,748)  (3,492)
        IN FUND         Debt Service - Revenue Bonds    (585)       (569)                -          -
        BALANCES        Capital Fund Transfers          (3,121)    (2,724)               -          -
                        Other Fund Transfers             (105)      (125)                -          -
                        Net Assets end of year                              ,   ,

        STATEMENT       ASSETS
        OF FINANCIAL      Cash and Investments         $ 17,059   $15,362           $67,347    $63,017
        POSITION          Pledges & Grants Receivable       832    1,084             5,446      6,688
                          Due from Forest Preserve District      -      -               0         671
                          Inventories                     776        899               776        899
                         Park Improvements, net             -          -            138,663    146,041
                        Net Deferred Bond Issuance Costs & Other  (301)  900          1,647       983
                        Total Assets                   ,     ,           ,    ,
                        LIABILITIES AND NET ASSETS
                          Accounts Payable and Accrued Liabilities   $ 5,324   $ 5,686  $ 5,324  $ 5,776
                          Deferred Revenue              7,889       7,483             7,889     7,483
                          Revenue Bonds Payable             -          -             35,320     35,706
                          Accrued Sick Pay              1,755      1,848              1,755     1,848
                          Accrued Postretirement Benefi ts     2,627    2,225        2,627      2,225
                          Other                           196        153               567      1,116
                        Total Liabilities               ,    ,           ,   ,

                        Net Assets                                          ,   ,
                        Total Liabilities and Net Assets    ,    ,       ,    ,
                        For a complete set of audited fi nancial statements, please contact the offi  ce of the Director.


                                                                      CHICAGO ZOOLOGICAL SOCIETY | ANNUAL IMPACT REVIEW  29
   26   27   28   29   30   31   32   33   34   35   36